Book Image

SQL Server 2016 Reporting Services Cookbook

By : Dinesh Priyankara, Robert Cain
Book Image

SQL Server 2016 Reporting Services Cookbook

By: Dinesh Priyankara, Robert Cain

Overview of this book

Microsoft SQL Server 2016 Reporting Services comes with many new features. It offers different types of reporting such as Production, Ad-hoc, Dashboard, Mash-up, and Analytical. SQL Server 2016 also has a surfeit of new features including Mobile Reporting, and Power BI integration. This book contains recipes that explore the new and advanced features added to SQL Server 2016. The first few chapters cover recipes on configuring components and how to explore these new features. You’ll learn to build your own reporting solution with data tools and report builder, along with learning techniques to create visually appealing reports. This book also has recipes for enhanced mobile reporting solutions, accessing these solutions effectively, and delivering interactive business intelligence solutions. Towards the end of the book, you’ll get to grips with running reporting services in SharePoint integrated mode and be able to administer, monitor, and secure your reporting solution. This book covers about the new offerings of Microsoft SQL Server 2016 Reporting Services in comprehensive detail and uses examples of real-world problem-solving business scenarios.
Table of Contents (18 chapters)
SQL Server 2016 Reporting Services Cookbook
Credits
About the Authors
About the Reviewers
www.Packtpub.com
Preface

Understanding the new Mobile Report Publisher


In this section, we'll take a brief look at the new Mobile Report Publisher. We'll identify the various components of the tool and what each is used for.

Getting ready

Before you can use the Mobile Report Publisher, you'll need to install it. You can do so from the Report Portal. In the Report Portal header, simply click on the down arrow on the upper right. From the menu, select Mobile Report Publisher; it will open up a web page from which you can download and install the Mobile Report Publisher:
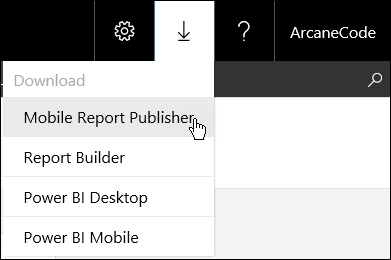
Figure 6.01

How to do it...

  1. After installation, launch the Mobile Report Publisher. When it launches, you will see this image:

    Figure 6.02

  2. On the upper left are four tabs: Layout, Data, Settings, and Preview. Clicking on each one will populate the tool panel on the left, under the tabs, with the appropriate tools for the area:

    Figure 6.03

  3. While on the Layout tab, scroll down. You will see other visual tools available, such as Charts, Maps, and Data grids...