Book Image

Learning Tableau 10 - Second Edition

Book Image

Learning Tableau 10 - Second Edition

Overview of this book

Tableau has for some time been one of the most popular Business Intelligence and data visualization tools available. Why? Because, quite simply, it’s a tool that’s responsive to the needs of modern businesses. But it’s most effective when you know how to get what you want from it – it might make your business intelligent, but it isn’t going to make you intelligent… We’ll make sure you’re well prepared to take full advantage of Tableau 10’s new features. Whether you’re an experienced data analyst that wants to explore 2016’s new Tableau, or you’re a beginner that wants to expand their skillset and bring a more professional and sharper approach to their organization, we’ve got you covered. Beginning with the fundamentals, such as data preparation, you’ll soon learn how to build and customize your own data visualizations and dashboards, essential for high-level visibility and effective data storytelling. You’ll also find out how to so trend analysis and forecasting using clustering and distribution models to inform your analytics. But it’s not just about you – when it comes to data it’s all about availability and access. That’s why we’ll show you how to share your Tableau visualizations. It’s only once insights are shared and communicated that you – and your organization – will start making smarter and informed decisions. And really, that’s exactly what this guide is for.
Table of Contents (17 chapters)
Learning Tableau 10 Second Edition
Credits
About the Author
About the Reviewers
www.PacktPub.com
Preface

Practical examples


Having looked at some of the foundational concepts of table calculations, let's consider some practical examples. We'll start with some simple ones and move toward complexity.

Year – over – Year growth

Often, businesses want to compare year over year values, meaning they want to see how quarters (or months or weeks) in one year compared with the same quarters (or months or weeks) in the previous year.

Tableau exposes Year over Year Growth as one option in the Quick Table Calculations. Here, for example, is a view that demonstrates Sales by Quarter along with the percent difference in sales for a quarter compared with the same quarter in the previous year, as shown:

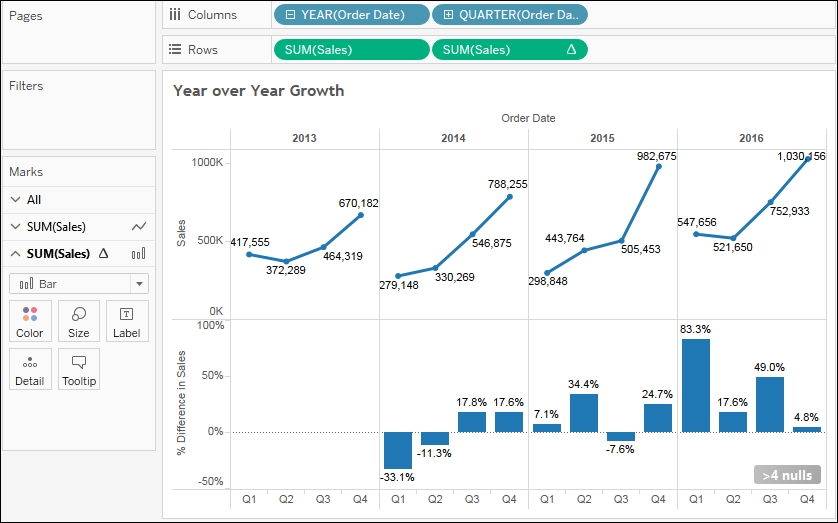
The second Sum(Sales) field has had the Year over Year Growth quick table calculation applied (and the mark type changed to bar). You'll notice the >4 nulls indicator in the lower-right corner alerting you to the fact that there are at least four null values (which makes sense as there is no 2012 to compare...