Book Image

Big Data Analytics with Java

By : RAJAT MEHTA
Book Image

Big Data Analytics with Java

By: RAJAT MEHTA

Overview of this book

This book covers case studies such as sentiment analysis on a tweet dataset, recommendations on a movielens dataset, customer segmentation on an ecommerce dataset, and graph analysis on actual flights dataset. This book is an end-to-end guide to implement analytics on big data with Java. Java is the de facto language for major big data environments, including Hadoop. This book will teach you how to perform analytics on big data with production-friendly Java. This book basically divided into two sections. The first part is an introduction that will help the readers get acquainted with big data environments, whereas the second part will contain a hardcore discussion on all the concepts in analytics on big data. It will take you from data analysis and data visualization to the core concepts and advantages of machine learning, real-life usage of regression and classification using Naïve Bayes, a deep discussion on the concepts of clustering,and a review of simple neural networks on big data using deepLearning4j or plain Java Spark code. This book is a must-have book for Java developers who want to start learning big data analytics and want to use it in the real world.
Table of Contents (21 chapters)
Big Data Analytics with Java
Credits
About the Author
About the Reviewers
www.PacktPub.com
Customer Feedback
Preface
Free Chapter
1
Big Data Analytics with Java
8
Ensembling on Big Data
12
Real-Time Analytics on Big Data
Index

Line charts


These types of charts are useful in regression techniques as we will see later. It's a simple chart represented by a line that shows the changes in data either by time or some other value. Even Time Series charts are a type of line chart. Here is an example of a Time Series chart:

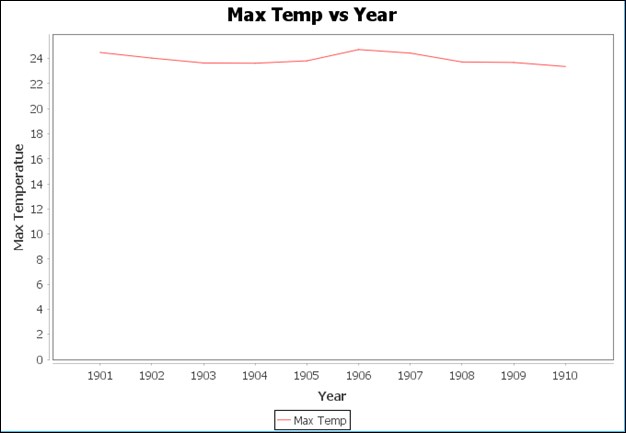
This line chart is a simple chart showing Max Temp versus Year, In this case, max temperatures are from 1901 to 1910. The chart shows that the temperature did not change drastically within these 10 years.

To build this line chart, we have used the same All India seasonal and annual min/max temperature series dataset as explained in the preceding Time Series charts. For building the charts, the steps are again the same:

  1. Loading the chart dataset and creating a JFreeChart-specific dataset.

    • We will create a similar createDataset method and return our DefaultCategoryDataset object

         private DefaultCategoryDataset createDataset() {
         DefaultCategoryDataset dataset = new DefaultCategoryDataset();
    • Next, we go...