Book Image

Data Analysis with R, Second Edition - Second Edition

Book Image

Data Analysis with R, Second Edition - Second Edition

Overview of this book

Frequently the tool of choice for academics, R has spread deep into the private sector and can be found in the production pipelines at some of the most advanced and successful enterprises. The power and domain-specificity of R allows the user to express complex analytics easily, quickly, and succinctly. Starting with the basics of R and statistical reasoning, this book dives into advanced predictive analytics, showing how to apply those techniques to real-world data though with real-world examples. Packed with engaging problems and exercises, this book begins with a review of R and its syntax with packages like Rcpp, ggplot2, and dplyr. From there, get to grips with the fundamentals of applied statistics and build on this knowledge to perform sophisticated and powerful analytics. Solve the difficulties relating to performing data analysis in practice and find solutions to working with messy data, large data, communicating results, and facilitating reproducibility. This book is engineered to be an invaluable resource through many stages of anyone’s career as a data analyst.
Table of Contents (24 chapters)
Title Page
Copyright and Credits
Packt Upsell
Contributors
Preface
Index

Multiple regression


More often than not, we want to include not just one, but multiple predictors (independent variables) in our predictive models. Luckily, linear regression can easily accommodate us! The technique? Multiple regression.

By giving each predictor its very own beta coefficient in a linear model, the target variable gets informed by a weighted sum of its predictors. For example, a multiple regression using two predictor variables looks like this:

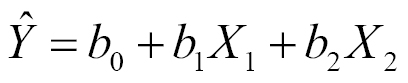
Now, instead of estimating two coefficients ( band  b1), we are estimating three: the intercept, the slope of the first predictor, and the slope of the second predictor.

Before explaining further, let's perform a multiple regression predicting gas mileage from weight and horsepower, using the following code:

  model <- lm(mpg ~ wt + hp, data=mtcars) 
  summary(model) 
   
  Call: 

  lm(formula = mpg ~ wt + hp, data = mtcars) 
   
  Residuals: 
     Min     1Q Median     3Q    Max  
  -3.941 -1.600 -0.182  1.050  5.854  
   
  Coefficients...