Book Image

Getting Started with Tableau 2018.x

By : Tristan Guillevin
Book Image

Getting Started with Tableau 2018.x

By: Tristan Guillevin

Overview of this book

Tableau is one of the leading business intelligence tools used worldwide, in organizations of every scale. In its latest release, Tableau 2018 promises richer and more useful features related to visual analytics, reporting, dashboarding, and a host of other data visualization aspects. Getting Started with Tableau 2018.x will get you up and running with these features. The book starts with all the new functionalities of the different Tableau 2018 versions, along with concrete examples of how to use them. However, if you're new to Tableau, don't worry! The rest of the book will guide you through each major aspect of Tableau with examples. You'll learn how to connect to data, build a data source, visualize your data, build a dashboard, and share it online. In the final chapters, you'll also learn advanced techniques such as creating a cross-database join, data blending, and more. By the end of the book, you will have a firm understanding of how to effectively use Tableau to create quick, cost-effective, and business-efficient business intelligence solutions.
Table of Contents (21 chapters)
Title Page
Copyright and Credits
Packt Upsell
Contributors
Preface
Free Chapter
1
Catching Up with Tableau 2018
Index

Simple transformations


Tableau is not a data-preparation tool. It's always better to have a clean file to start with. However, Tableau offers some simple transformation tools. When you connect to a dataset, you can, for example, use the Data Interpreter, split a column into multiple columns, or pivot your data. Let's see a case for these transformations.

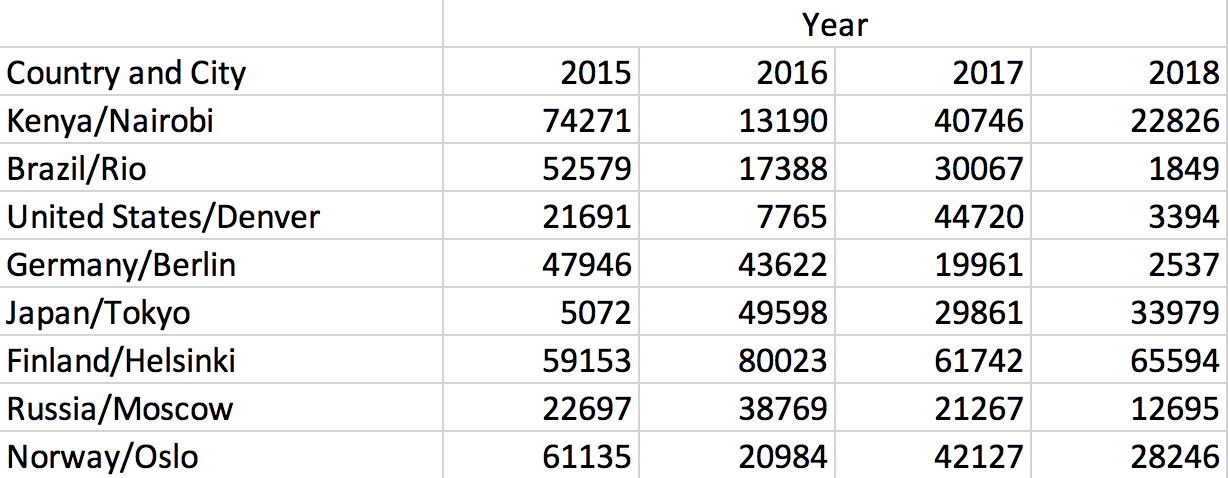
For this section, I created a dataset to clean in Excel, as illustrated here:

Note

If you want to reproduce the example, you can download the Dataset to clean  file from my website, book.ladataviz.com section in the Chapter 4: Connect To Data and Simple Transformation section, or use this direct link: https://ladataviz.com/wp-content/uploads/2018/09/Dataset-to-clean.xlsx.

Three things are problematic with this dataset:

  • There is a column header for the years
  • The countries and the cities are in the same column
  • Each year is in a different column, preventing the creation of a simple line chart

Now, let's fix the first problem of this dataset with the...