Book Image

Getting Started with Tableau 2018.x

By : Tristan Guillevin
Book Image

Getting Started with Tableau 2018.x

By: Tristan Guillevin

Overview of this book

Tableau is one of the leading business intelligence tools used worldwide, in organizations of every scale. In its latest release, Tableau 2018 promises richer and more useful features related to visual analytics, reporting, dashboarding, and a host of other data visualization aspects. Getting Started with Tableau 2018.x will get you up and running with these features. The book starts with all the new functionalities of the different Tableau 2018 versions, along with concrete examples of how to use them. However, if you're new to Tableau, don't worry! The rest of the book will guide you through each major aspect of Tableau with examples. You'll learn how to connect to data, build a data source, visualize your data, build a dashboard, and share it online. In the final chapters, you'll also learn advanced techniques such as creating a cross-database join, data blending, and more. By the end of the book, you will have a firm understanding of how to effectively use Tableau to create quick, cost-effective, and business-efficient business intelligence solutions.
Table of Contents (21 chapters)
Title Page
Copyright and Credits
Packt Upsell
Contributors
Preface
Free Chapter
1
Catching Up with Tableau 2018
Index

Dashboard basics


If a Worksheet is one idea, a Dashboard is a way to combine all those ideas. With a Dashboard, you can create interaction between the Worksheets, and add pictures, web pages, and other objects to create a unique page that will answer all your questions.

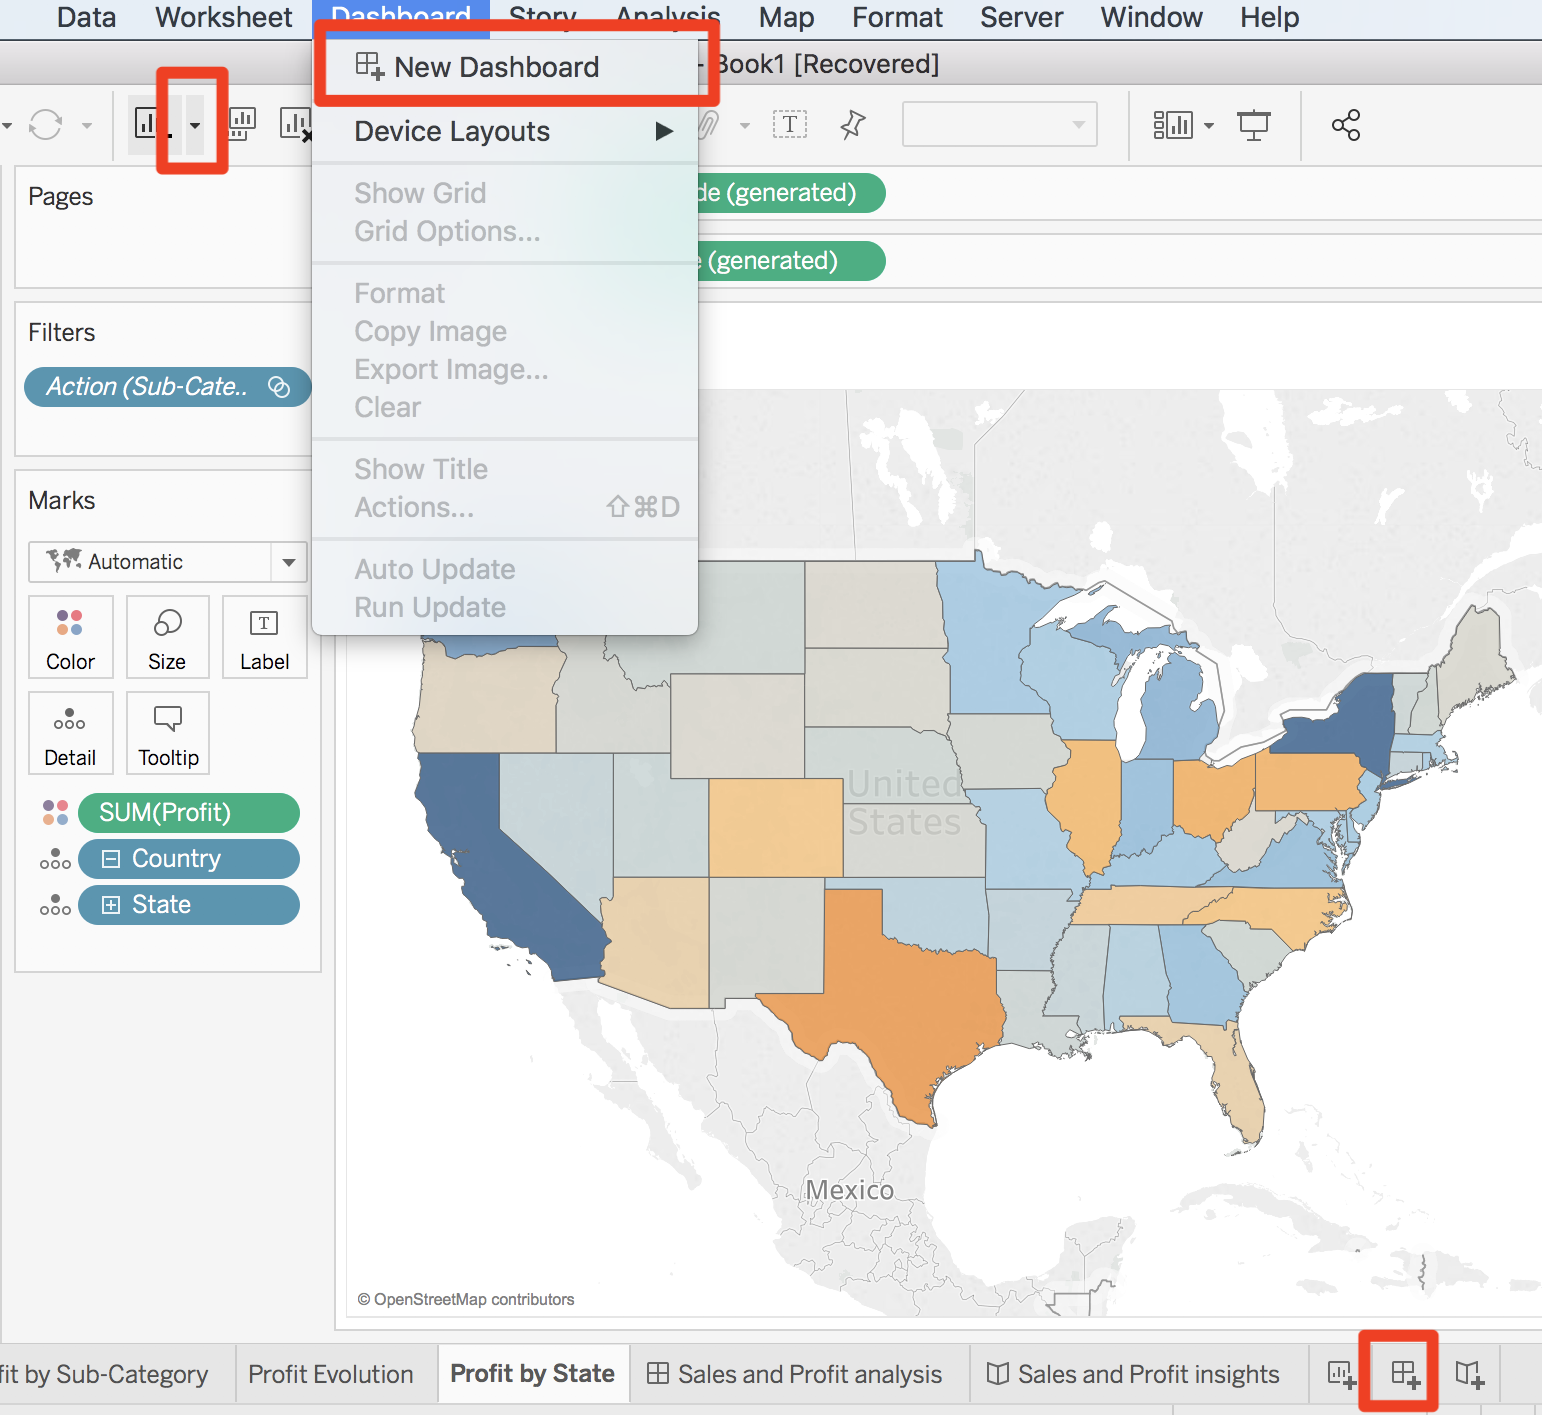
To add a new Dashboard, you can either click on the icon at the bottom-right, click on New Dashboard from the Dashboard top menu, or use the New Dashboard button in the toolbar, as highlighted in the following screenshot:

The Dashboard workplace is composed of a central blank part where you can drop Worksheets and objects. On the left pane, you can find two tabs: Dashboard and Layout.

Note

You can't see the data pane on the Dashboard anymore. If you need to modify it, you have to go on a Worksheet or create a temporary new Worksheet that you can delete afterwards.

Let's start by seeing how to build a Dashboard; then, we'll focus on the two different tabs.

How to build a Dashboard

To create a Dashboard, you have to drag Worksheets...