Book Image

matplotlib Plotting Cookbook

By : Alexandre Devert
Book Image

matplotlib Plotting Cookbook

By: Alexandre Devert

Overview of this book

Table of Contents (15 chapters)
matplotlib Plotting Cookbook
Credits
About the Author
About the Reviewers
www.PacktPub.com
Preface
Index

Adding a legend


A proper figure is not complete without its own legend. matplotlib provides a way to generate a legend with the minimal amount of effort. In this recipe, we will see how to add a legend to a graph.

How to do it...

For this recipe, we use the pyplot.legend() function as well as the label optional parameter:

import numpy as np
import matplotlib.pyplot as plt

X = np.linspace(0, 6, 1024)
Y1 = np.sin(X)
Y2 = np.cos(X)

plt.xlabel('X')
plt.ylabel('Y')

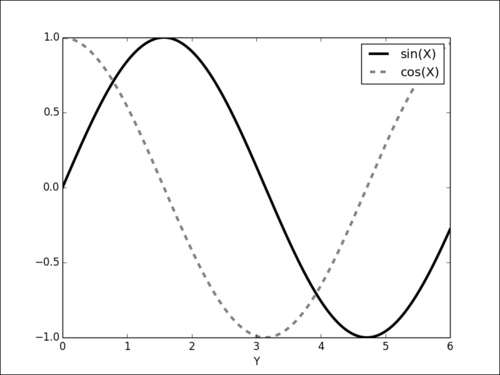
plt.plot(X, Y1, c = 'k',  lw = 3.,              label = 'sin(X)')
plt.plot(X, Y2, c = '.5', lw = 3., ls = '--', label = 'cos(X)')

plt.legend()
plt.show()

The preceding code gives the following output:

How it works...

Each pyplot function has an optional label parameter to name an element, such as curve, histogram, and so on, of a figure. matplotlib keeps a track of these labels. The pyplot.legend() function will render a legend. The legend is automatically generated from the labels.

There's more...

The pyplot.legend function has a couple...