Book Image

gnuplot Cookbook

By : Lee Phillips
Book Image

gnuplot Cookbook

By: Lee Phillips

Overview of this book

gnuplot is the world's finest technical plotting software, used by scientists, engineers, and others for many years. It is in constant development and runs on practically every operating system, and can produce output in almost any format. The quality of its 3d plots is unmatched and its ability to be incorporated into computer programs and document preparation systems is excellent. gnuplot Cookbook ñ it will help you master gnuplot. Start using gnuplot immediately to solve your problems in data analysis and presentation. Quickly find a visual example of the graph you want to make and see a complete, working script for producing it. Learn how to use the new features in gnuplot 4.4. Find clearly explained, working examples of using gnuplot with LaTeX and with your own computer programming language. You will master all the ins and outs of gnuplot through gnuplot Cookbook. You will learn to plot basic 2d to complex 3d plots, annotate from simple labels to equations, integrate from simple scripts to full documents and computer progams. You will be taught to annotate graphs with equations and symbols that match the style of the rest of your text, thus creating a seamless, professional document. You will be guided to create a web page with an interactive graph, and add graphical output to your simulation or numerical analysis program. Start using all of gnuplot's simple to complex features to suit your needs, without studying its 200 page manual through this Cookbook.
Table of Contents (18 chapters)
gnuplot Cookbook
Credits
About the Author
About the Reviewers
www.PacktPub.com
Preface
Finding Help and Information
Index

Plotting a function


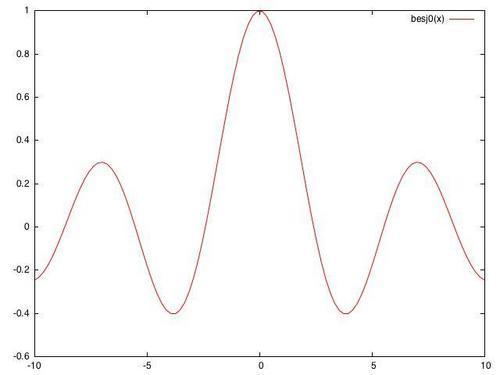
gnuplot can be used as a tool to interactively explore the structure of mathematical functions, as well as to create illustrations for publication or education. It has built-in knowledge of both elementary functions, such as sine and cosine, and some special functions, such as Bessel functions and elliptic integrals. The following figure shows the plotting of the besj0(x) function:

Getting ready

Start up an interactive gnuplot session and make sure that your graphic terminal of choice is selected, and working, using the set term command (for example, at the console you simply type gnuplot, and, to change the default terminal to X Windows, type set term x11).

How to do it…

Type plot besj0(x) at the console. The plot in the figure should pop up immediately.

There's more…

Gnuplot understands a big handful of mathematical functions, listed in Section 13.1 of the official manual (the official gnuplot documentation can be found at gnuplot's home, http://gnuplot.info/). It also understands all the basic mathematical operators, with a syntax similar to Fortran or C, so you can combine functions into expressions, as shown in the following command:

plot [-5:5] (sin(1/x) - cos(x))*erfc(x)

In the previous command, we have also shown how to use the [a:b] notation to limit the plot to a specified range on the x-axis.