Book Image

gnuplot Cookbook

By : Lee Phillips
Book Image

gnuplot Cookbook

By: Lee Phillips

Overview of this book

gnuplot is the world's finest technical plotting software, used by scientists, engineers, and others for many years. It is in constant development and runs on practically every operating system, and can produce output in almost any format. The quality of its 3d plots is unmatched and its ability to be incorporated into computer programs and document preparation systems is excellent. gnuplot Cookbook ñ it will help you master gnuplot. Start using gnuplot immediately to solve your problems in data analysis and presentation. Quickly find a visual example of the graph you want to make and see a complete, working script for producing it. Learn how to use the new features in gnuplot 4.4. Find clearly explained, working examples of using gnuplot with LaTeX and with your own computer programming language. You will master all the ins and outs of gnuplot through gnuplot Cookbook. You will learn to plot basic 2d to complex 3d plots, annotate from simple labels to equations, integrate from simple scripts to full documents and computer progams. You will be taught to annotate graphs with equations and symbols that match the style of the rest of your text, thus creating a seamless, professional document. You will be guided to create a web page with an interactive graph, and add graphical output to your simulation or numerical analysis program. Start using all of gnuplot's simple to complex features to suit your needs, without studying its 200 page manual through this Cookbook.
Table of Contents (18 chapters)
gnuplot Cookbook
Credits
About the Author
About the Reviewers
www.PacktPub.com
Preface
Finding Help and Information
Index

Putting equations in your labels


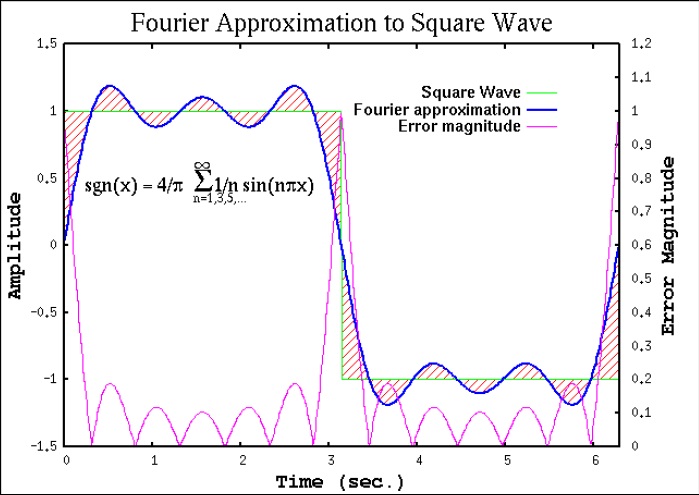
Certain terminals support enhanced text, which means that they accept a markup language specific to gnuplot that can be used to include characters from various fonts, set subscripts, superscripts, overprint characters, and generally manipulate text with sufficient flexibility to create simple equations to serve as annotations for your graphs. This recipe shows how to make such an equation, but you will see that the markup is cumbersome, and attaining the desired result requires some amount of trial and error. Frankly, a better way to create all but the simplest mathematical text is to use the LaTeX techniques covered in a later chapter, which also leads to a much more attractive output.

However, the enhanced text mode can be useful for quickly placing some mathematical text on your plot, in situations where you are not too picky about the typographical quality of the result.

How to do it…

The following script is similar to the script in the Adding a label with...