Book Image

QlikView 11 for Developers

Book Image

QlikView 11 for Developers

Overview of this book

Business Intelligence technologies are a must-have in every business to make informed decisions and keep up-to speed with the ever-evolving markets. QlikView's disruptive technology makes it a key player and leader in the industry; with its flexibility and powerful analytics environment, building QlikView apps can be mastered by both, business users as well as developers. This book will help you learn QlikView Development from a basic to a practitioner level using a step-by-step approach in a practical environment, and apply proven best practices on each topic. Throughout the book, we will build a QlikView app based on real data about Airline Operations that will help "HighCloud Airlines" make informed business decisions and analysis-guided strategies. HighCloud Airlines executives are evaluating if entering the US market is a good strategy and, if so, which line of business should they focus their investments on; they need QlikView to make the best decision. The application will be evolving chapter by chapter, along with your skills, going from a simple proof of concept to creating a Data Model, adding a custom style, building a Dashboard and handling and manipulating the source data via script. We will meet the "HighCloud Airlines" requirement by using many different data visualization objects and time-saving techniques. The whole application uses real data taken from the Bureau of Transportations statistics of the US and encompasses the operations of Airlines both domestic and international. With three years worth of data, you will help HighCloud Airlines discover where people travel the most, which are the Carriers with the most market share, what is the average load factor per airline, which aircraft is the most used to perform flights, which are the busiest airports, and a whole universe of new insights.
Table of Contents (23 chapters)
QlikView 11 for Developers
Credits
Foreword
About the Authors
Acknowledgements
About the Reviewers
www.PacktPub.com
Preface
Index

A tip on copying expressions


We will close this chapter on advanced expressions by sharing a tip that can save you quite some time when developing QlikView documents. You have noticed that, when defining a chart's expressions, we not only define the formula, but also expression attributes, number format, presentation, labels, alignment, and so on. It is very common that, when using more than one expression in a chart (a straight table, for instance), two or more of these expressions are very similar in terms of formatting and sometimes also in the formula itself.

In those cases, we can simply copy and paste an expression within the Expressions tab of the Chart Properties window to replicate the entire expression definition and then adjust whichever parameters or definitions we need to, thus saving a great deal of time and work.

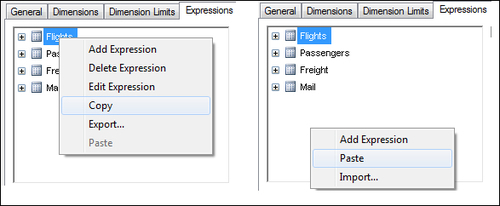
To do this, simply right-click on the name of the expression you want to replicate and right-click again on the blank space below the expressions list to paste it.