Book Image

Getting Started with SQL Server 2012 Cube Development

Book Image

Getting Started with SQL Server 2012 Cube Development

Overview of this book

Analysis Services have been the number one OLAP engine for years. With the increased focus on business intelligence solutions, there is a shortage of professionals in this area. Start your journey into becoming a BI developer using the popular tools included in every SQL Server installation. Getting Started with SQL Server 2012 Cube Development teaches you through clear step-by-step exercises to create business intelligence solutions using Analysis Services. The knowledge gained through these practical examples can immediately be applied to your real-world problems. Getting Started with SQL Server 2012 Cube Development begins with an introduction to business intelligence and Analysis Services, the world's most-used cube engine. Guiding you through easy-to-understand examples to become a cube developer. Learn how to create a cube including all the advanced features such as KPIs, calculated measures, and time intelligence. Security and performance tuning will also be explored. You will learn how to perform and automate core tasks like deployment and processing. The main focus is on multidimensional cubes, but the creation of in-memory models will also be covered. You will learn everything you need to get started with cube development using SQL Server 2012.
Table of Contents (17 chapters)
Getting Started with SQL Server 2012 Cube Development
Credits
About the Author
About the Reviewers
www.PacktPub.com
Preface
Index

Specifying other types of tables and columns


In the previous section you marked the DimDate table as a date table. There are other options that you can specify on tables and columns to control the behavior when using special types of reporting tools.

These options can be found under the column properties in the Reporting Properties section; there you have the Data Category property that allows you to specify how the column will be treated.

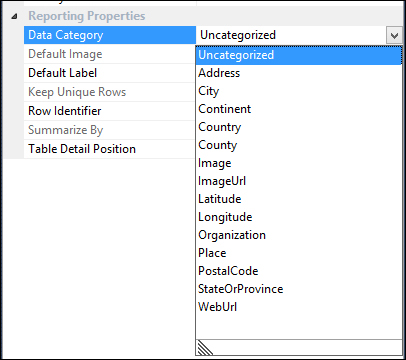
Power View is one tool that checks this property when you create reports, as an example when you add a column with the category of ImageUrl, it automatically follows the URL and displays the image in the report instead of showing the URL as a text string.

You can also specify the default columns that will be added to the report when the table is selected by a user. This is specified under the Table Detail Position option. For more information on how to configure this please see the the online manual at http://msdn.microsoft.com/en-us/library/hh479569.aspx...