Book Image

ActionScript Graphing Cookbook

Book Image

ActionScript Graphing Cookbook

Overview of this book

"A picture is worth a thousand words" has never been more true than when representing large sets of data. Bar charts, heat maps, cartograms, and many more have become important tools in applications and presentations to quickly give insight into complicated issues.The "ActionScript Graphing Cookbook" shows you how to add your own charts to any ActionScript program. The recipes give step-by-step instructions on how to process the input data, how to create various types of charts and how to make them interactive for even more user engagement.Starting with basic ActionScript knowledge, you will learn how to develop many different types of charts.First learn how to import your data, from Excel, web services and more. Next process the data and make it ready for graphical display. Pick one of the many graph options available as the book guides you through ActionScript's drawing functions. And when you're ready for it, branch out into 3D display.The recipes in the "ActionScript Graphing Cookbook" will gradually introduce you into the world of visualization.
Table of Contents (17 chapters)
ActionScript Graphing Cookbook
Credits
About the Authors
About the Reviewers
www.PacktPub.com
Preface
Index

Creating a treemap


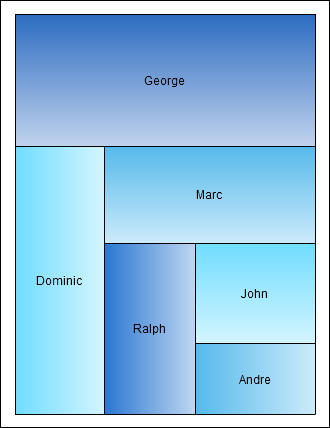
In this recipe we are going to build a treemap. Treemaps are used to represent the data structure of a tree (nodes that have nodes as children). In this example, we are going to use it more as a rectangular pie chart. Wherever you can use a pie chart, you will be able to use this treemap, but it will give you the ability to use something a bit different.

Getting ready

Open the files in the Treemap folder in the downloadable code files from www.packtpub.com.

How to do it...

  1. Let's start by creating the data structure that is TreemapData.as:

    public var color : uint;
    public var percent : Number;
    public var label:String;
    public function TreemapData(newPercent:Number, newColor:uint, newLabel:String) {
      percent = newPercent;
      color = newColor;
      label = newLabel;
    }
  2. From there we can jump to Treemap.as. We will need to inversely sort the data as our first step. To do so we will create a sorting function and pass it to the sort function of Array. The following is what the sorting...