

Kettle jobs and transformations are full of visual indicators to help us easily and quickly understand why and when the flows follow this path, if the task or step is running, whether it's terminating successfully or not, or other such similar things. Taking care of these indications helps us a lot in understanding if everything has gone, or will go, according to what we intended.
Let's see some examples. While designing a transformation in Spoon, you can see that the connections between the steps (called hops) assume different colors or representation in different situations. The following screenshot shows a Data Validator step with a set of inputs and two outputs:
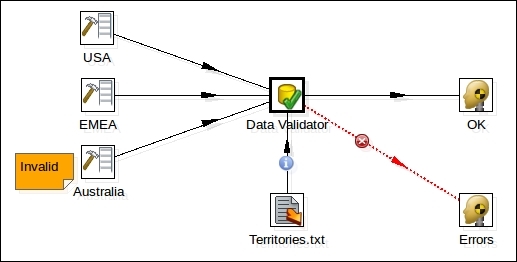
We can note two interesting things here:
One of the two output hops has been designed with a bold red dotted line, and this line has a red icon with an "x" sign on it. The red dotted line represents a path that carries the lines that caused an error. In this case, the error is related to the failure of the validation rule in the Data Validator step. The red "x" icon represents a graphical sign that enforces the information that this is an error path.
One of the input hops has a circular blue icon with a lowercase "i" character in it. This icon indicates that the hop connects a source step whose rows are an input to configure a parameter of the target step. In this case, the row that comes from the Text File Input step named Territories.txt configures a set of "allowed territories" that must be used to validate the rows that are coming in.
We can summarize the meaning behind the various hop colors as shown in the following table:
|
Color |
Meaning |
|---|---|
|
Green |
The hop distributes rows; if multiple hops are leaving a step, rows of data will be distributed evenly to all the target steps |
|
Red |
The hop copies rows; if multiple hops are leaving a step, all rows of data will be copied to all the target steps |
|
Yellow |
The hop provides information for the step and distributes rows |
|
Gray |
The hop is disabled |
|
Black |
The hop has a named target step |
|
Blue |
Candidate hop using middle button and drag |
|
Red (bold dotted line) |
The hop is used for carrying rows that caused errors in the source step(s) |
Other kinds of icons can be found while designing transformations in other situations. Let's see another example where a Filter step is going to be used:
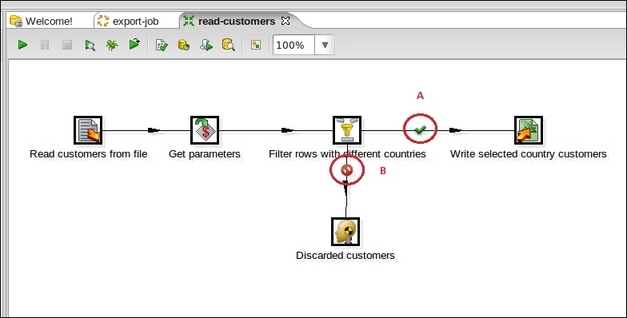
As you can see, the Filter step named Filter rows with different countries has two different output hops with two different icons indicated by the two red bold letters A and B:
The icon indicated by the bold red letter A means that the hop is followed only when the condition specified in the Filter step has been satisfied (the result of the evaluation is true)
The icon indicated by the bold red letter B means that the hop is followed only when the condition specified in the Filter step has not been satisfied (the result of the evaluation is false)
Similar concepts apply to a job's hops. Let's have a look at the following example:
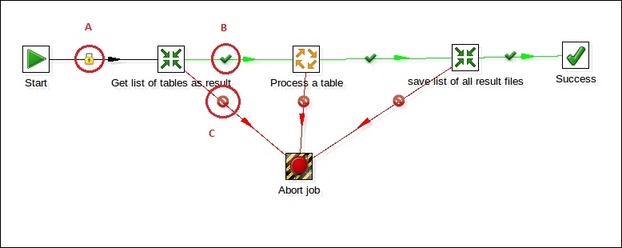
Because the jobs are process orchestrators in this case, a job hop is just an element of flow control. Hops link to job entries, and based on the results of the previous job entry, they determine what happens next. Icons help us to indicate the conditions under which that particular hop is followed:
Unconditional – The icon identified by the red bold letter A in the screenshot represents this condition. It specifies that the next job entry will be executed regardless of the result of the originating job entry.
Follow when result is true – The icon identified by the red bold letter B in the screenshot represents this condition. It specifies that the next job entry will be executed only when the result of the originating job entry is true.
Follow when result is false – The icon identified by the red bold letter C in the screenshot represents this condition. It specifies that the next job entry will be executed only when the result of the originating job entry is false.
Again, hops in jobs assume different colors depending on the properties and the state of the job at that particular point:
The hop connecting two tasks is black anytime the target entry is executed regardless of the result of the source entry (unconditional)
The hop connecting two tasks is green anytime the target entry is executed if the result of the source entry is successful (result is true)
The hop connecting two tasks is black anytime the target entry is executed if the result of the source entry is unsuccessful (result is false)