

Strategy is all about where to play and how to win. So far, we have discussed a bit about both. Different companies follow different processes and use different frameworks to develop their strategies. Companies adopt and adapt these approaches to meet their specific context and comfort. Big data analytics should never force you to abandon your current practices, but it should help augment them. There are two techniques that will assist you in this—gather as much data as possible and keep asking what kind of metrics or insights would you like to see out of the data. Let us look at some models.
Kaplan and Norton developed the renowned and much adopted Strategy Map and Balanced Score Card tools around the four seminal influences of financial perspective, customer perspective, internal perspective, and learning and growth perspective. While the Strategy Map translates and communicates the strategy for mass consumption, the Balanced Score Card approach provides the mechanism to cascade, deploy, and monitor the implementation of the strategy. These tools help executives educate the organization about the value creation process and its impact.
In creating the strategy map, Kaplan and Norton recommend keeping in mind the following different perspectives:
Financial Perspective: This perspective is based on the creation of long-term shareholder value
Customer Perspective: This perspective is based on clearly articulating the customer value proposition
Internal Perspective: This perspective is based on improving processes around operations, customer management, innovation, regulatory, safety, community engagement, and other such areas
Learning and Growth Perspective: This perspective is based on improving the talent pool, information systems, and organizational vigor
All of these considerations are already based on data; you can further strengthen the process by considering the complete spectrum. Let's reflect on a few examples:
You have an initiative around strategic pricing to improve your profitability. You are designing pricing strategies as part of this initiative around customer segmentation and the significance of your products and services to your customers. You will also look at some historical pricing data from your company, and may even stretch your research scope to the data from your competitors (if available) or get creative in exploring similar strategies adopted by non-adjacent suppliers to the same customer. To validate your theories, you will most likely run some experiments.
Now, how about you build a model that incorporates your customer's profitability, competitive pressures, market trends, and the share of your products and services into their revenue/profit delivery cycles? Most of this data is available today and may not be easy to access or analyze. This will most likely be a combination of unstructured and streaming data. But if you can build a comprehensive model that big data analytics can enable you to do, you can have a very robust pricing strategy that will significantly benefit your business. If your company makes an 8 percent return on sales, then a 1 percent pricing improvement leads to a 12.5 percent improvement on your current shareholder returns.
Let's consider another example from a different domain:
In most organizations, the HR department maintains an inventory of skills its employees possess. The supervisors of the employees will usually validate those skills; sometimes tests are conducted to assess the skill levels. Most of the skills that are recorded are oriented towards what what employees need to do their job. Employees are learning new skills, getting new experiences, and possibly have expertise in non-job related fields, which might be of use for the company. These snippets of information will usually not be stored in a traditional skill inventory system; definitely not on anywhere close to a real-time basis. However, if we leverage the social media aspects of a company and the data captured through in-process activities, we will get insights into the new nuggets of information just described. So now you can enrich your traditional skill inventory with new learning enabled by big data.
Therefore, while developing strategies, there are two major questions you need to keep in mind:
Have you considered all the possible data?
Does your improved understanding of all data bring any new possibilities?
Regardless of which strategy framework you currently use, these questions are universally useful.
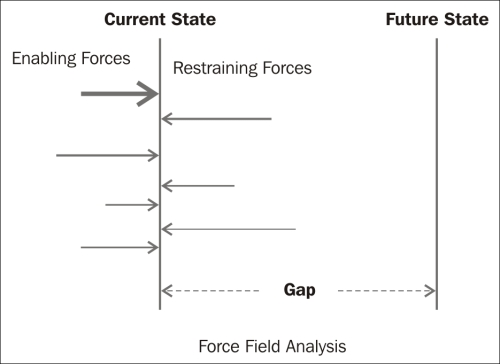
Force Field Analysis is another technique many strategy experts use. This can be a very practical and easy method, especially when applied to create a growth roadmap using big data.
In Force Field Analysis, you have essentially two states and two forces:
The two states are:
Current state: This represents the current state of your business in terms of market position, profitability, revenue, or any other parameter on which you want to do a comparison
Future state: This represents the future desired state of your business on the same terms of comparison as current state analysis
The two forces are:
Enabling forces: These are the driving forces that help you achieve your goals of moving from current to future state
Restraining forces: These are the limiting forces that resist your efforts to achieve your desired future state
We start Force Field Analysis by drawing two parallel lines that represent a current state and desired state going from left to right to show progression. Then, we include all the enabling forces on the left-hand side of the current state. Then we put all the restraining forces to the right of the current state line. To make it more interesting, you can actually change the length and thickness of the arrows that represent the various forces relative to their impact on enabling or restraining. This form of representation allows us to visually understand at a glance what factors are at play to further or slow down our strategy. This is a good starting point to identify strategic initiatives that will enable us to overcome the challenges.
Please remember that you may not always be able to eliminate all the restraining forces. Once you have the preceding diagram for your business, you need to work on making some of the enabling forces more potent and try reducing the potency of some of the restraining forces so that you are able to reduce the net gap.
If you replace forces with data in the preceding diagram, and apply the same action decision principles, you can draw a roadmap of how to use data from your existing data repository to reach your desired state of business.
