
One of the best ways to learn a new set of tools, such as a programming environment and language, is to experiment with them. We're going to have some fun doing that throughout this book. We're going to experiment where the cost of errors (otherwise known as Learning) is small. Our development work will be a custom application of NAV 2013 for a relatively simple, but realistic, application.
We're going to do our work using the Cronus demo database that is available with all NAV 2013 distributions and is installed by default when we install the NAV 2013 demo system. The simplest way to install the NAV 2013 demo is to locate all the components on a single workstation. A 64-bit system running Windows 7 Professional will suffice. Additional requirements information is available in the MSDN library (www.msdn.com) under the heading System Requirements for Microsoft Dynamics NAV 2013. Other helpful information on installing NAV 2013 (the demo option is a good choice for our purposes) and addressing a variety of setup questions is available in the NAV 2013 area of the MSDN library. In fact, all the Help information for NAV 2013 is accessible in the MSDN library.
The Cronus database contains all of the NAV objects and a small, but reasonably complete, set of data populated in most of the system's functional applications areas. Our exercises will interface very slightly with the Cronus data, but do not depend on any specific data values.
To follow along with our exercises as a developer, you will need a developer license for the system with rights allowing the creation of objects in the 50,000 to 50,099 number range. This license should also allow at least read access to all of the objects numbered below 50,000. If you don't have such a license, check with your Partner or your Microsoft sales representatives to see if they will provide a training license for your use.
Our company runs a small, for-profit radio station. The station is WDTU and it broadcasts at 91.5 FM. The radio station is free form, which means there are many different DJs all with their own style and music. Each DJ is given a three-hour slot of time, and is responsible for playing the government required public service announcements (PSAs), sports, news and weather at the top of each hour, and a set amount of paid advertisements.
We have been moving our vast vinyl and compact disc collection to high-quality MP3s on our internal data store, but will still allow DJs to bring in their own music if we don't have it in our library. For the music already converted, we need to have a user-friendly interface to select the songs played and to preview them for entry into the playlist. We also need an easy way for the DJ to create a provisional item if the record cannot be found.
Our DJs must be able to preview all songs that have been converted to MP3s on the show page as well as on their home page. To succeed as a for-profit business, the radio station needs to track what, when, and how many advertisements are broadcast in order to invoice customers. In order to operate as a licensed radio station, there are two major requirements and reporting agencies. ASCAP needs a list of all songs (or other copyrighted material) that is played during the shows during specific time periods. The government requires that the radio station perform public service by broadcasting PSAs, reporting the date and time each was played and reporting the total number of times each was played during a period of time. Currently, both reporting agencies require one month reporting intervals, but this may change.
Our design for our radio station will start with a Radio Show table, a Radio Show Card page, a Radio Show List page, and a simple Radio Show Schedule List Report. Along the way, we will review the basics of each NAV object type.
When we open the NAV Development Environment for the first time, or to work on a different database, we must define what database should be opened. Click on File | Database | Open, then choose a database, as shown in the following screenshot:
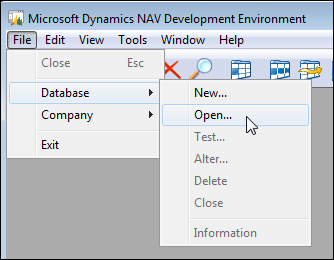
Table objects are the foundation of every NAV application. Tables contain data structure definitions, as well as properties that describe the behavior of the data, including data validations and constraints.
More business logic is required in complex applications than simple data type validation, and NAV allows C/AL code to be put in the table to control insertion, modification, and deletion of records as well as logic on the field level. When the bulk of the business logic is coded at the table level, it is easier to develop, debug, support, modify, and even upgrade. A good design in NAV requires that as much of the business logic as possible should reside in the tables.
Our primary master data table will be the Radio Show table, as this is the link between what we get paid for (advertisements) and what we owe (song royalties), as well as meeting our civic duty requirement (PSAs).
First, we will open the NAV Development Environment, click on Tools| Object Designer and select Table. We can view the design of existing master tables in NAV by highlighting the table (for example, Table 18 - Customer, or Table 27 - Item) and clicking on Design.
Each master table has a standard field for the primary key (a Code data type field of 20 characters called No.) and has standard information regarding the entity the master record represents (for example, Name, Address, City, and so on for the Customer table, and Description, Base Unit of Measure, Unit Cost, and so on for the Item table).
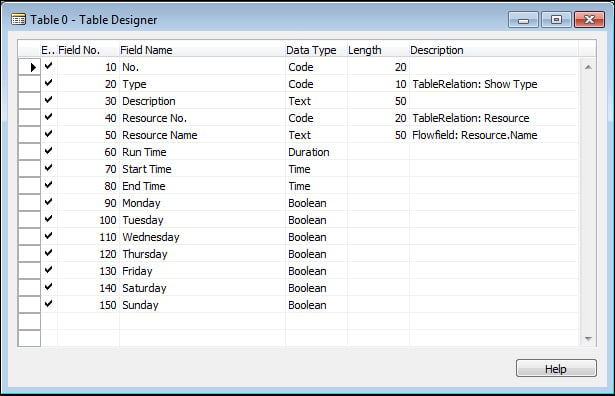
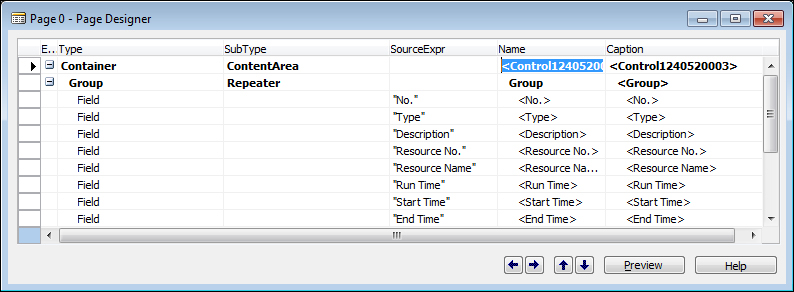
The Radio Show table will have the following field definitions:
|
Field names |
Definitions |
|---|---|
|
No. |
20 character text (code) |
|
Type |
10 character text (code) |
|
Description |
50 character text |
|
Resource No. |
20 character text (code) |
|
Resource Name |
50 character text |
|
Run Time |
Duration |
|
Start Time |
Time |
|
End Time |
Time |
|
Monday |
Boolean |
|
Tuesday |
Boolean |
|
Wednesday |
Boolean |
|
Thursday |
Boolean |
|
Friday |
Boolean |
|
Saturday |
Boolean |
|
Sunday |
Boolean |
In the preceding list, three of the fields are defined as Code fields, which are text fields that limit the alphanumeric characters to upper case values. Code fields are used throughout NAV for primary key values. Code fields are used to reference or be referenced by other tables (also known as foreign keys). The No. will be the unique identifier in our table. We will utilize a set of standard internal NAV functions to assign a user-defined No. Series range that will auto increment the value on table insertion and possibly allow for user entry (as long as it is unique in the table) based on a setup value. The Resource No. references the standard Resource table and the Type field will reference a custom table we will create to allow for flexible Type values.
We will need to design and define the reference properties at the field level in the Table Designer window, as well as compile them, before the validation will work. At this point, let's just get started with some field definitions and create the foundation for the Radio Show table.
To view the table designer, open the NAV 2013 Development Environment and the database in which we will be doing our development. In the Object Designer window, click on Table (in the left column of buttons) and click on New (in the bottom row of buttons). Enter the first field number as 10 (the default is 1), and increment each remaining field number by 10 (the default is 1). This will allow us to add additional fields in between existing fields later, when necessary.
Tip
Once a table is referenced by other objects, or contains any data, the field numbers of previously-defined fields should not be changed.
In the Description field, we will put notes for the fields that will need properties set at a later time. The following screenshot shows our new table definition in the Table Designer window:
Now we can close the table definition. (Click on File | Save or Ctrl + S or press ESC or close the window. The first two options are the explicit methods of saving our work.) We will see a message reminding us to save our changes, as shown in the following screenshot:
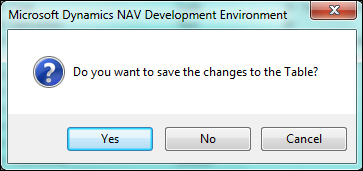
Click on Yes to save the changes. We must now assign the object number (in this case use 50000) and a unique name (it cannot duplicate the first 30 characters of another table object in the database). We will name our table Radio Show because that is the type of master record we will be storing in the table. The Save As window is shown in the following screenshot:
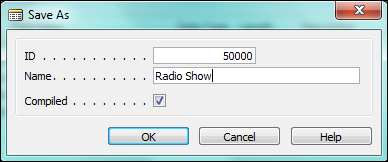
Note that the Compiled option is automatically checked, which is the default for NAV. Once we click on OK and the object is successfully compiled, it is immediately ready to be executed within the application. If the object we were working on was not ready to be compiled without error, we could unselect the Compiled option in the Save As window, as shown in the preceding screenshot.
Tip
Be careful, as uncompiled objects will not be considered by C/SIDE when changes are made to other objects. Until we have compiled an object, it is a work in progress, not an operable routine. There is a Compiled flag on every object that gives its compilation status. Even when we have compiled an object, we have not confirmed that all is well. We may have made changes that affect other objects which reference the modified object. As a matter of good work habit, we should recompile all objects before we end work for the day.
Pages provide views of data or processes designed for on-screen display (or exposure as web services) and also allow for user data entry into the system. Pages act as containers for action items (menu options).
There are several basic types of display/entry pages in NAV, they are given as follows:
List
Card
Document
Journal/Worksheet
There are also page parts (they look and program like a page, but aren't intended to stand alone) as well as user interfaces that appear as pages, but are not page objects. The latter user interfaces are generated by various dialog functions.
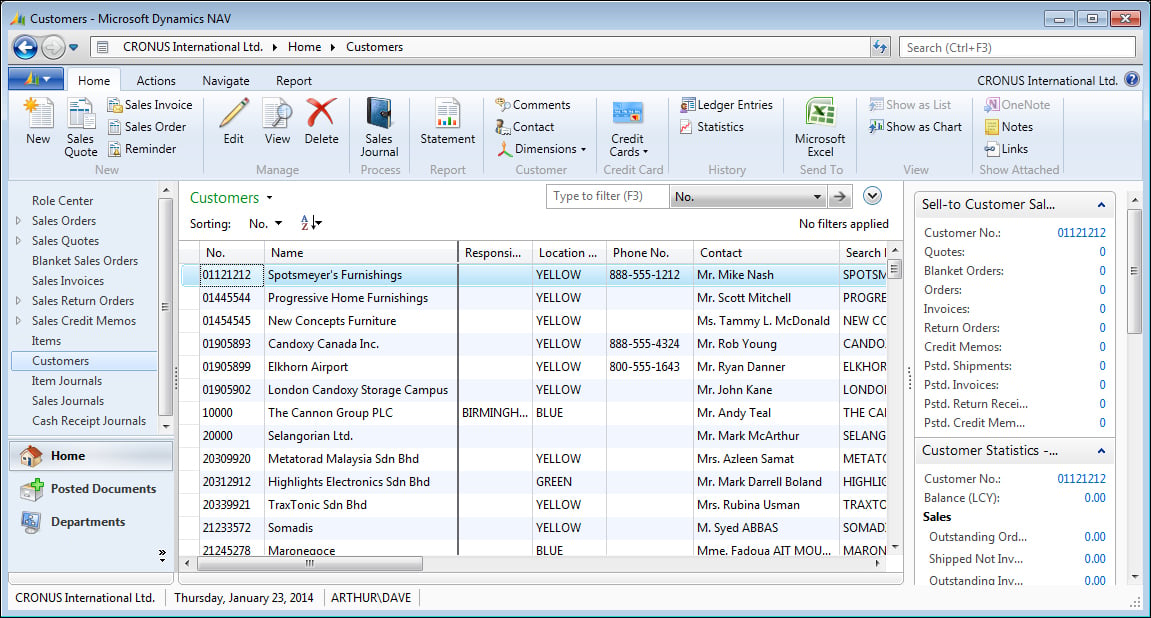
List pages display a simple list of any number of records in a single table. The Customer List page (with its associated FactBoxes) in the following screenshot shows a subset of the data for each customer displayed. List pages/forms often do not allow entry or editing of the data. Journal/Worksheet pages look like list pages, but are intended for data entry. Standard list pages are always displayed with the navigation pane on the left. The Customer List page is seen in the following screenshot:
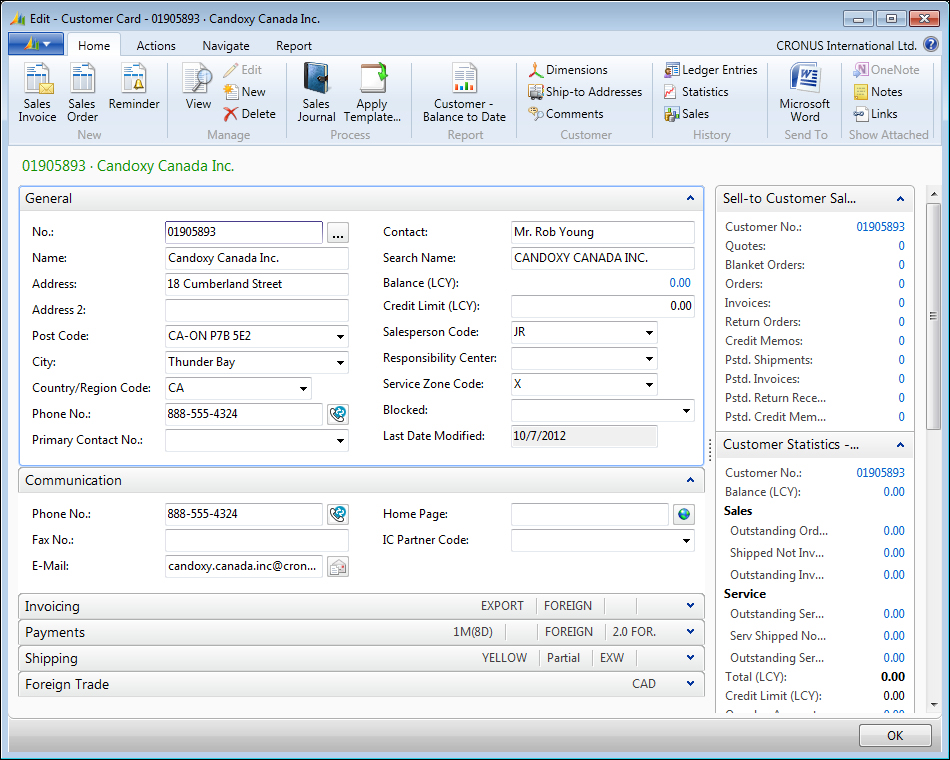
Card pages display one record at a time. These are generally used for the entry or display of individual table records. Examples of frequently accessed card pages include Customer Card for customer data, Item Card for inventory items, and G/L Account Card for General Ledger accounts.
Card pages often have FastTabs (one FastTab consisting of a group of controls with each tab focusing on a different set of related customer data). FastTabs can be expanded or collapsed dynamically, allowing the data visible at any time to be controlled by the user.
Card pages for master records display all the required data entry fields. Typically, they also display summary data about related activity so that the Card page can be used as the primary inquiry point for master records. The following screenshot is a sample of a standard Customer Card:
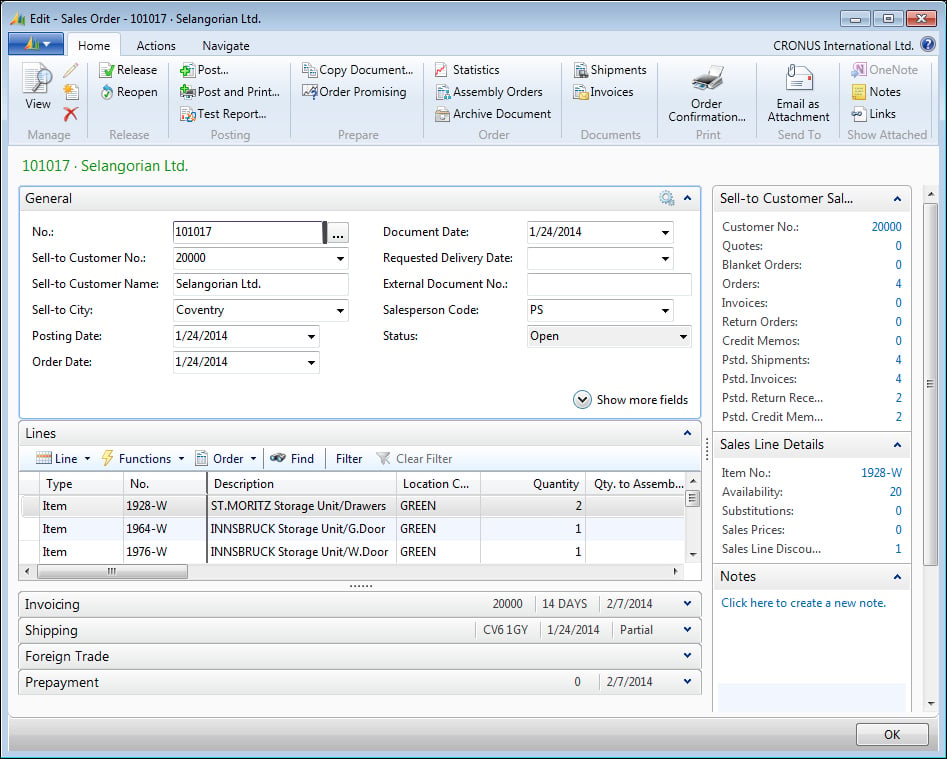
Another page style within NAV consists of what looks like a Card page plus a List page. An example is the Sales Order page as shown in the following screenshot. In this example, the upper portion of the page is in Card page format with several tabs showing sales order data fields that have a single occurrence on the page (in other words, they do not occur in a repeating column). The lower portion of the Document page is in List page format (all fields are in repeating columns) showing the Sales Order line items.
Line items may include product to be shipped, special charges, comments, and other pertinent order details. The information to the right of the data entry is related data and computations (FactBoxes) that have been retrieved and formatted. At the top of the page is the information for the Ordering customer. The bottom right contains information for the item on the selected line. The following screenshot shows an example of the Sales Order Document page:
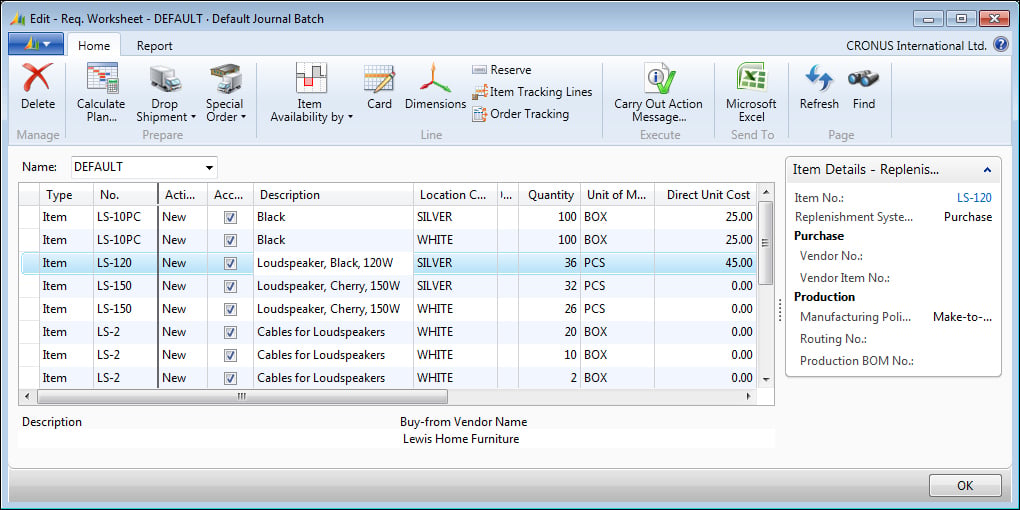
Journal and Worksheet pages look very much like List pages. They display a list of records in the body of the page. Many have a section at the bottom that shows details about the selected line and/or totals for the displayed data. These pages may also include a Filter pane and perhaps a FactBox. The biggest difference between Journal/Worksheet pages and basic List pages is that Journal and Worksheet pages are designed to be used for data entry (though this may be a matter of personal or site preference). An example of the Requisition Worksheet page in Purchasing is shown in the following screenshot. The Req. Worksheet assists the user in determining and defining which purchases should be made. Refer the following screenshot:
A page consists of page properties and triggers, controls, control properties, and triggers. Data controls generally are either labels displaying constant text or graphics, or containers that display data or other controls. Controls can also be buttons, action items, and page parts. While there are a few instances where we must include C/AL code within a page or page control triggers, it is good practice to minimize the amount of code embedded within pages. Any data-related C/AL code should be located in the table object rather than in the page object.
Now we will create a List page for the table we created earlier. A List page is the initial page that is displayed when a user accesses any data table. The NAV Development Environment has wizards (object generation tools) to help create basic pages. Generally, we should expect to spend additional time in the Page Designer tool, after our wizard work, to make the layout ready to be presented to users.
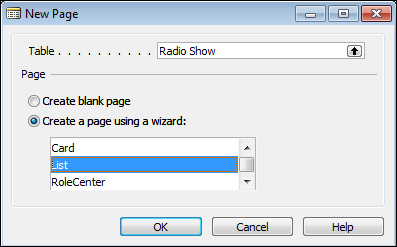
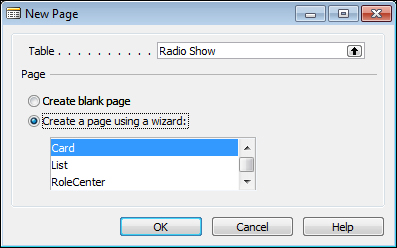
Our first List page will be the basis for viewing our Radio Show master records. From the Object Designer window, click on Page, then click on New. The New Page screen will appear. Enter the name (Radio Show) or table object ID (50000) in the Table field. This is the table to which the page will be bound. We can add additional tables to the page object C/AL Global Variables after we close the wizard, as we are then working within the Object Designer. Choose the option Create a page using a wizard: , and select List. Click on OK, as shown in the following screenshot:
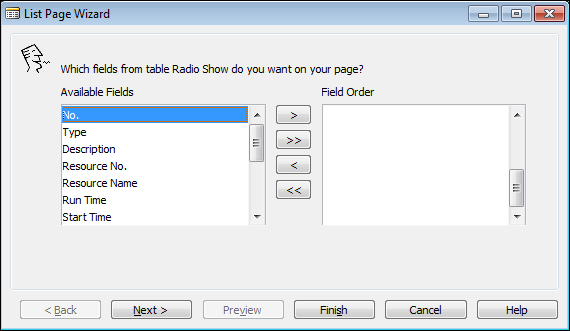
The next step in the wizard shows the fields available for the List page. We can add or remove any of the field columns using the >, <, >>, and << buttons. This is shown in the following screenshot:
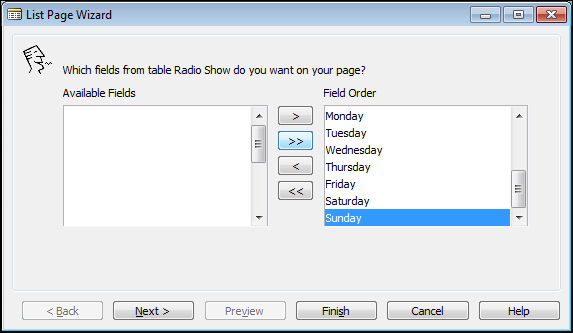
Add all the fields using >> and click on Next, as shown in the following screenshot:
The next wizard step shows the available Subforms, System FactBoxes, and Charts that are available to add to our page. These can be seen in the following screenshot:
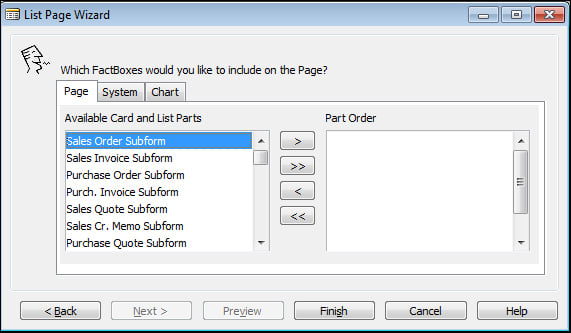
We can add these later in the Page Designer window as needed. Click on Finish to exit the List Page Wizard and enter the Page Designer, which is shown in the following screenshot:
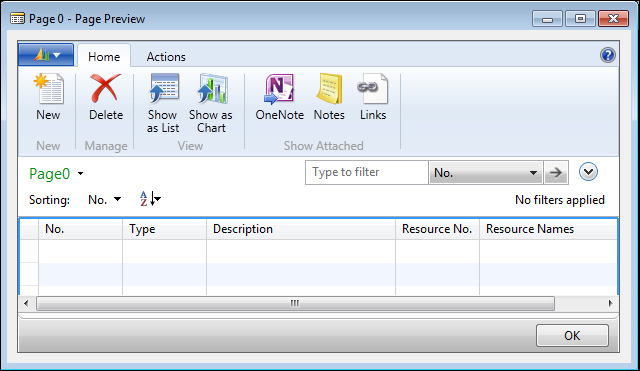
Click on Preview to view the page with the default ribbon. Note that in the Preview mode we cannot insert, modify, or delete any data. The Preview page is not connected to the database data. We will need to compile the page and Run it to manipulate the data. The Page Preview window is shown in the following screenshot:
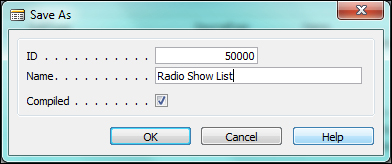
The availability of some capabilities and icons (such as OneNote) will depend on what software is installed on our development workstation. Close the preview of the List page and close the window or press ESC to save. Number the page 50000 and name the object Radio Show List, as shown in the following screenshot:
Next, let's create a
Card page. The wizard process for a Card page is almost the same as for a List page, with an additional step. In Object Designer, with the Page option selected, click on New again. Enter the same table (Radio Show) and make sure the Create a page using a wizard: option is selected and that Card is highlighted, as shown in the following screenshot:
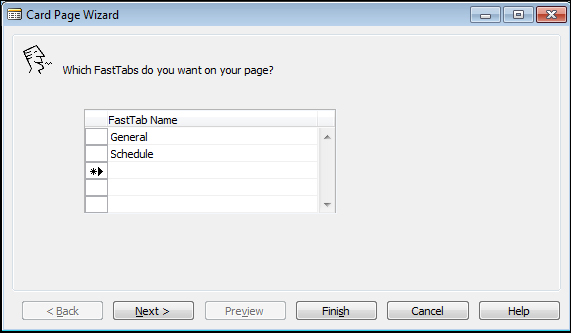
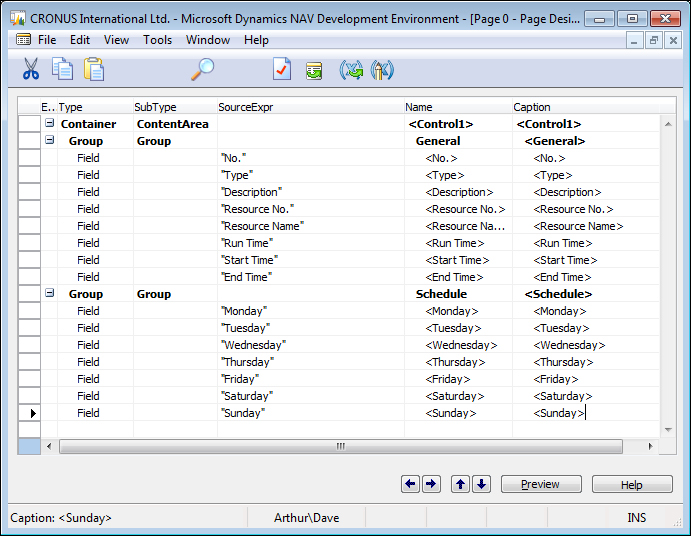
The next step in the wizard is specific to Card pages, which allows us to create FastTabs. These are the display tools that allow the user to expand or collapse window sections for ease of viewing. For our Radio Show we will divide our table fields into two FastTab sections as shown in the following screenshot. The FastTabs will be General (primary key, description, resource information, and duration) and Schedule (days of the week), as shown in the following screenshot:
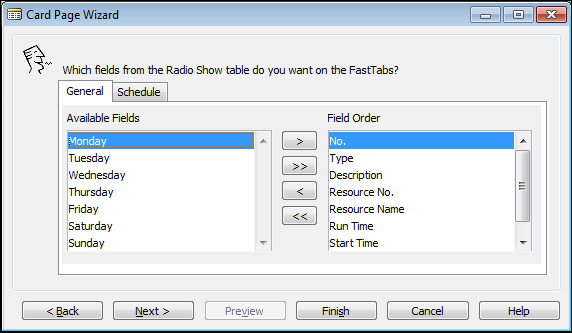
After defining the FastTab names, we must assign the data fields to the tabs on which they are to appear. We will select the tabs based on the FastTab names we assigned. We can select the fields from the Available Fields list and assign the order as we did in List Page Wizard. Click on the Next> button to proceed.
For the General FastTab, select the following fields: No., Type, Description, Resource No., Resource Name, Run Time, Start Time, and End Time, as shown in the following screenshot:
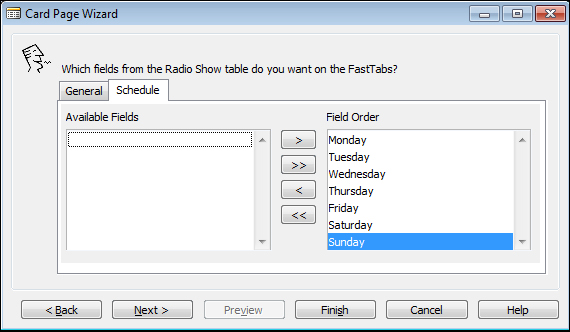
Click on the Schedule tab to populate the Schedule FastTab. Select Monday, Tuesday, Wednesday, Thursday, Friday, Saturday, and Sunday, as shown in the following screenshot:
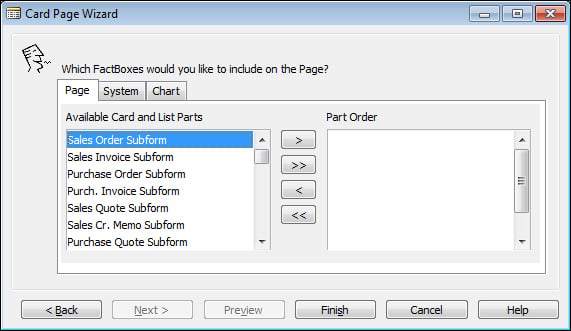
The last Card Page Wizard step is to add the available Subpages, System FactBoxes, and Charts. Again, if we decide later we want any of those, we will add them from within the Page Designer window. The last step is shown in the following screenshot:
Click on Finish to view the generated code in the Page Designer dialog. We will have the following screen:
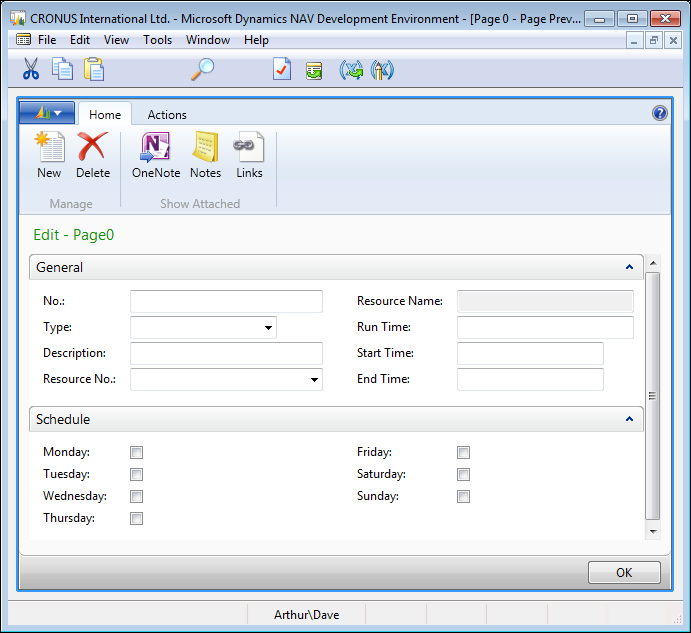
Click on Preview to show a view-only display of the card page, which will display as follows:
Exit out of the Preview
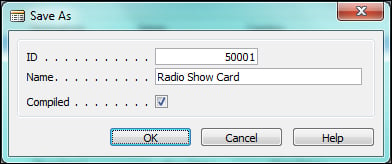
and Page Designer windows and save the page as ID 50001, and Name as Radio Show Card, as shown in the following screenshot:
Later on we can add an action to the List page which will link to the Card page for to insert and edit Radio Show records. We will also add the List page to the Role Center page for our radio station user.
Even though we haven't added all the bells and whistles to our Radio Show table and pages, we can still use them to enter sample data. The Radio Show list page will be the easiest to use for this.
In Object Designer, with pages selected, highlight page 50000, Radio Show list, and click on Run. Then click the New icon on the ribbon. An empty line will open up where we can enter our sample data. Of course, since our table is very basic at this point, without any validation functionality, table references, function calls, and so on, we will need to be creative and enter all the individual data fields accurately and completely on our own. Examples are shown in the following screenshot:
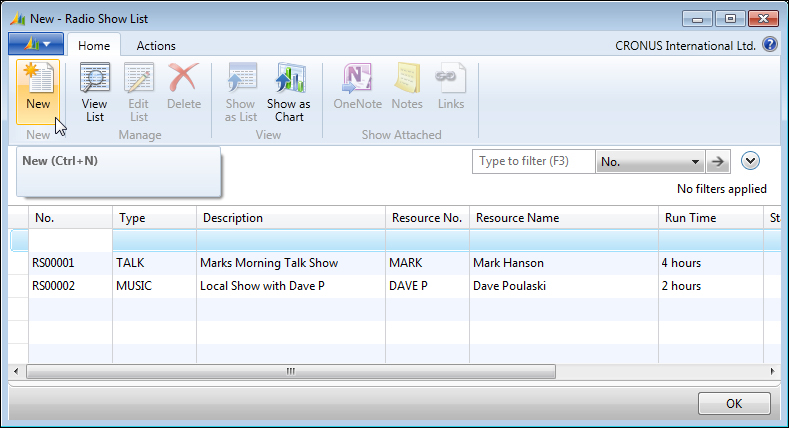
Enter the data shown in the following table. Later on, after we add more capabilities to our table and pages, some of the fields will be either automatically entered or available on a lookup basis. But for now, simply key in each field value. If the data that we key in now conflicts with the validations we create later (such as data in referenced tables), we may need to delete this test data and enter new test data later. Consider this data temporary so that we can see what the page looks like with the data. The data is given in the following table:
|
No. |
Type |
Description |
Resource No. |
Resource Name |
Run Time |
|---|---|---|---|---|---|
|
RS00001 |
TALK |
Marks Morning Talk Show |
MARK |
Mark Hanson |
4 hours |
|
RS00002 |
MUSIC |
Local Show with Dave P |
DAVE P |
Dave Poulaski |
2 hours |
|
RS00003 |
CALL-IN |
What's Up Metro City? |
LINDA |
Linda Martin |
2 hours |
|
RS00004 |
CALL-IN |
I'm Listening Metro City |
MATT S |
Matt Saunders |
2 hours |
|
RS00005 |
MUSIC |
Working It Out Afternoon Show |
MATTR |
Matt Richards |
3 hours |
|
RS00006 |
MUSIC |
World News |
PHIL |
Phil Petersen |
3 hours |
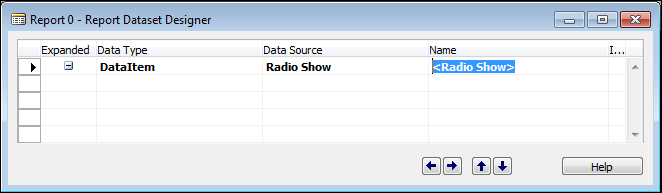
Open the Object Designer, select
Report and click on New. The Report Dataset Designer is empty when it displays, so we need to add the first Data Source (table) to the first blank row. Type 50000 or Radio Show into the Data Source column, as shown in the following screenshot:
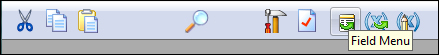
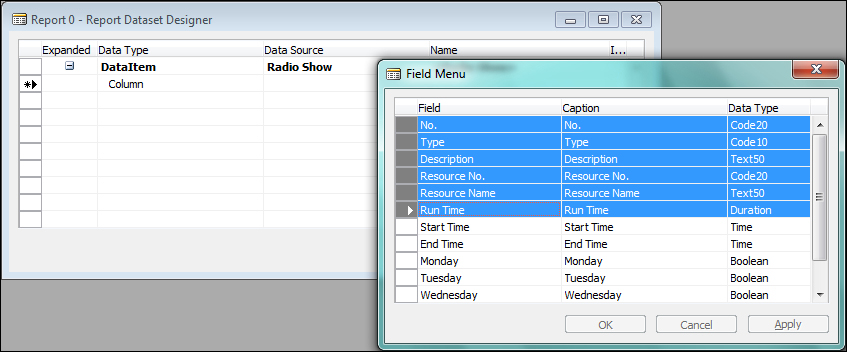
To add multiple data fields from the table we can use the Field Menu option, which can be accessed via the icon on the toolbar or the View | Field Menu. The Field Menu option will show a list of all the fields in the Radio Show table. The toolbar is shown in the following screenshot:
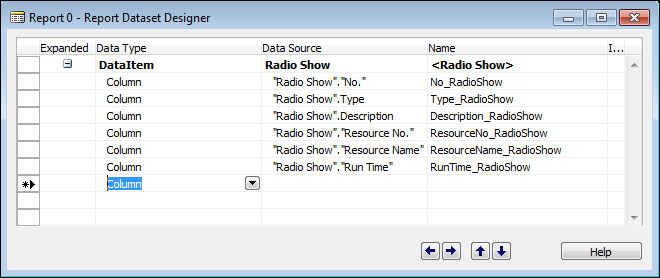
Highlight the first six fields in the Field Menu dialog. Then click on the next blank line in Report Dataset Designer, as shown in the following screenshot:
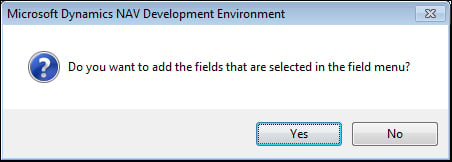
A confirmation box will appear asking if we want to add the fields selected. Click on Yes, highlighted in the following screenshot:
The fields will appear in the Report Dataset Designer dialog without needing to type them in manually, as shown in the following screenshot:
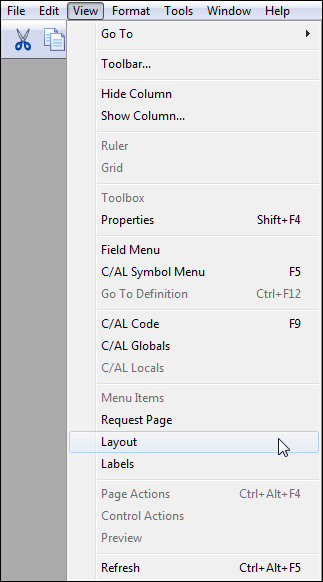
Now we need to proceed to the report layout tool which is part of Visual Studio 2010 (or the free Visual Web Developer 2010 Express). Click on View | Layout, as shown in the following screenshot:
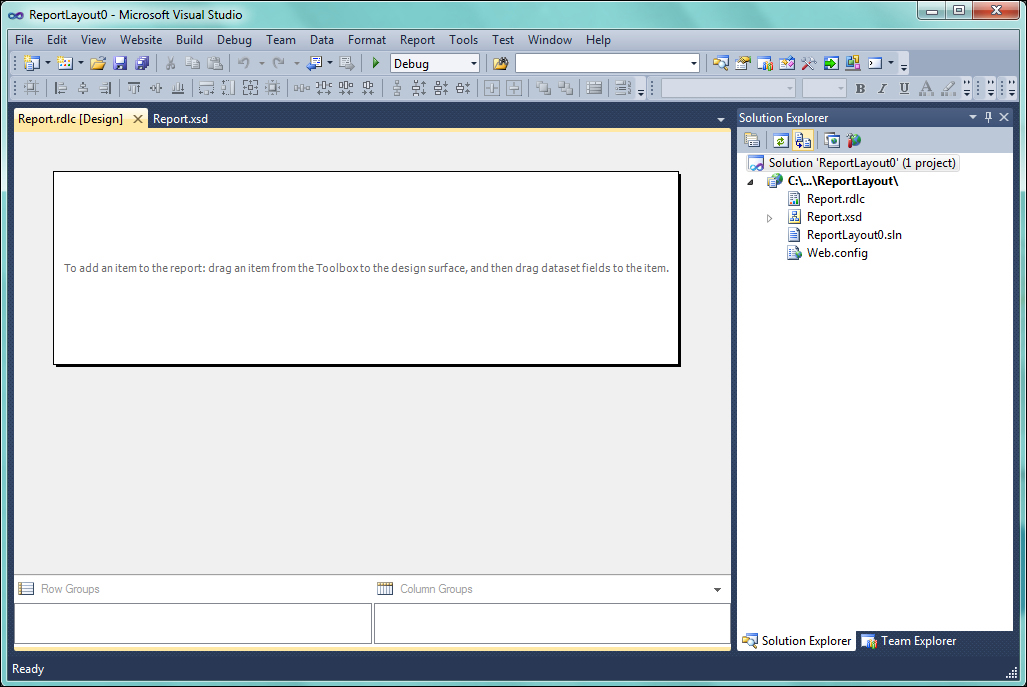
Visual Studio 2010 will open with a blank design surface and no dataset controls visible. Unlike the Page Designer, there is no report wizard to help with the layout of a new report. All the report layout design work must start from scratch with the blank design surface. The report design surface is shown in the following screenshot:
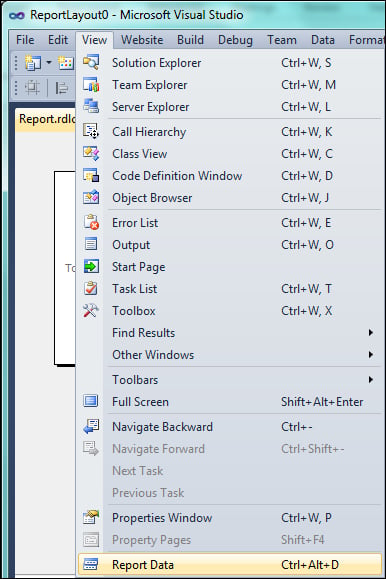
To show the dataset available from NAV, click on View and select Report Data (the last item on the list), as shown in the following screenshot:
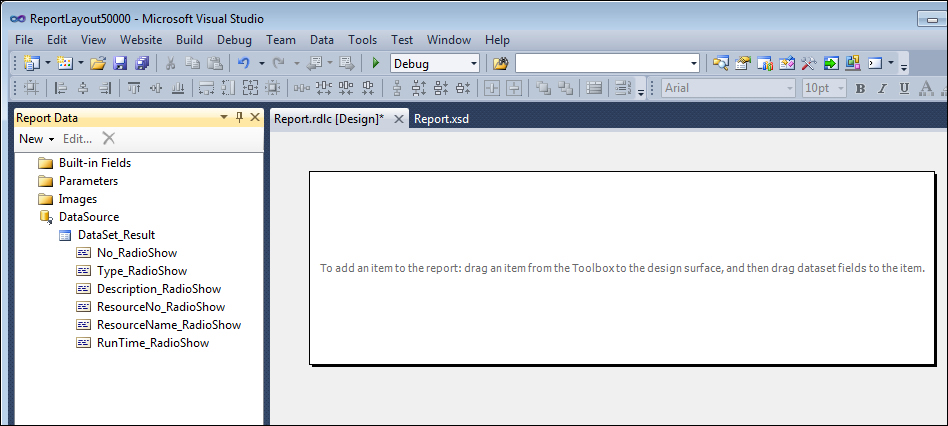
A new Report Data pane will show on the left of the Visual Studio layout window, as seen in the following screenshot:
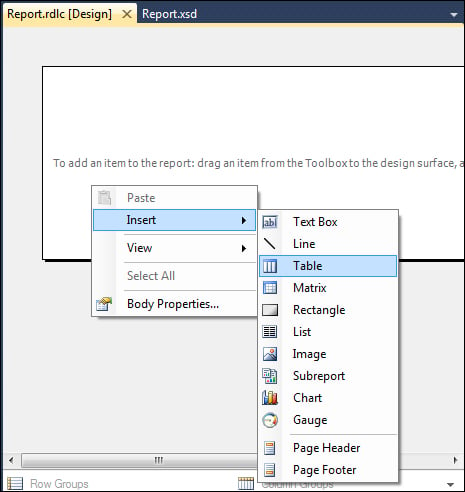
To create our simple list we will insert a simple table object (a data region with fixed number of columns but variable number of rows) to the design surface. Right-click anywhere on the design surface and expand the Insert sub-menu to view the tools available on the report. Click on the Table tool object, then we can use drag-and-drop to bring controls from the toolbox to the design surface. These steps are shown in the following screenshot:
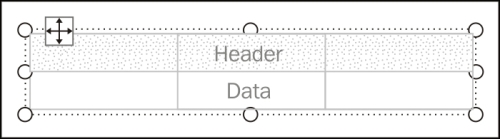
The table layout object defaults to three columns with a Header row (repeated once) and a Data row (repeated for each row of data retrieved from NAV). This is shown in the following screenshot:
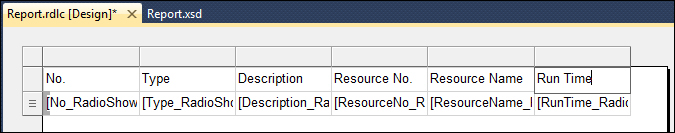
Drag-and-drop each of the six columns into the Table object. To add additional columns, right-click on the table object header and select Add Columns (we could also drag-and-drop a field from the dataset to the table). The caption with the basic format of Field Name Table Name will default into the header row (for example, the field name Type followed by the table name Radio Show), as shown in the following screenshot:

Let's do a little clean-up in the header row by making the captions look as they do in standard NAV reports by manually typing in the field names as headings, as shown in the following screenshot. (Later on, we will learn that this is not the optimum method and these headings should be defined in the C/SIDE RD before we get to the VS RD.)
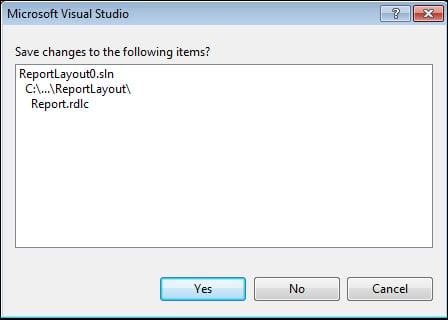
We will save our work by clicking on File | Save All (or Ctrl + Shift + S) and then exit from Visual Studio (File | Exit or Alt + F4). Next, we will see the Save changes? to the RDLC (client report definition data) confirmation box. Click on Yes, as shown in the following screenshot:
Back in NAV Object Designer, exit out of the report or click on File | Save, and we will need to respond to two confirmation boxes. The first asks if we want to save the report layout from Visual Studio. Click on Yes, as shown in the following screenshot:
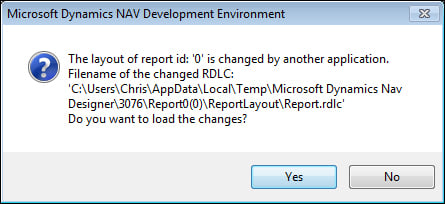
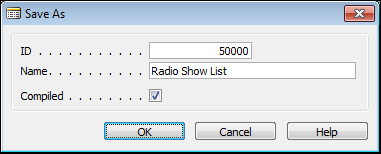
The second confirmation appears when we change focus to the Report Designer. It allows us to load the RDLC report layout XML into the NAV database report object. Enter 50000 for the ID, and name the report Radio Show List. Click OK to save it, as shown in the following screenshot:
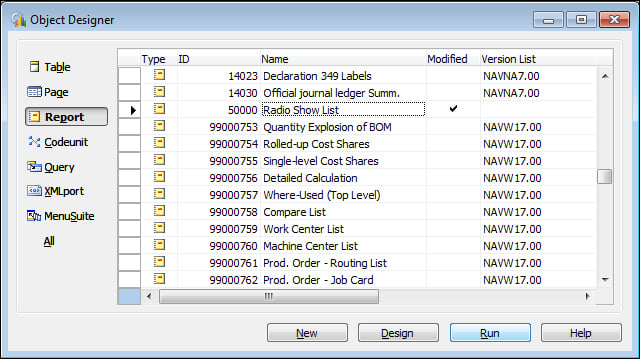
To view the report, make sure the new report object is selected, then click on Run in the Object Designer dialog, as shown in the following screenshot:
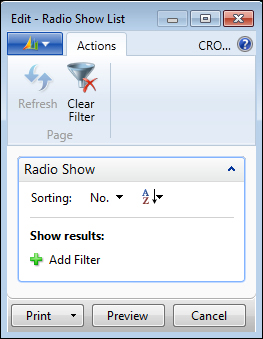
An instance of RTC (Role Tailored Client) will open with the Report Request Page showing. This is where the user can set filters, choose a sort sequence and choose print options. For our example, this page is shown in the following screenshot:
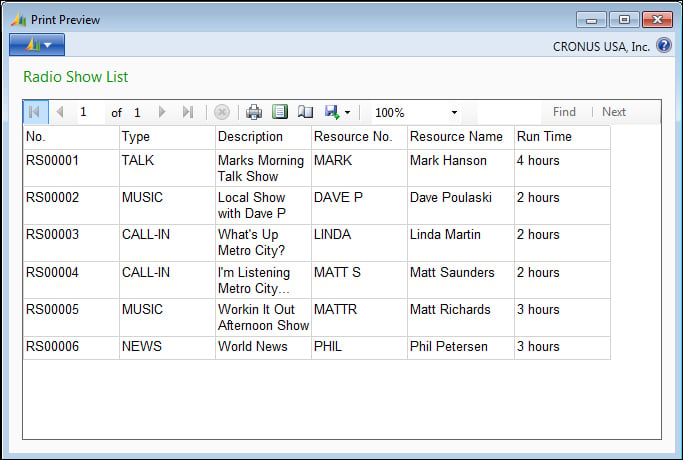
Click on Preview to display the report onscreen. The report will show our simple table layout with the fixed definition column captions showing exactly as we typed them. This is seen in the following screenshot:
We'll finish up our introductory review of NAV's object types.
A codeunit is a container for chunks of C/AL code to be called from other objects. These chunks of code are called functions. Functions can be called from any of the other NAV object types that can contain C/AL code. Codeunits can also be exposed (published) as web services. This allows the functions within a published codeunit to be invoked by external routines.
Codeunits are suited structurally to contain only functions. Even though functions could be placed in other object types, the other object types have superstructures that relate to their designed primary use as pages, reports, and so on.
Codeunits act only as a container for C/AL-coded functions. They have no auxiliary functions, no method of user interaction, and no pre-defined processing. If we are creating one or two functions that are closely related to the primary activity of a particular report, but these functions are needed from both within and outside of the report, then, by all means, include the functions in the report. Otherwise, use a Codeunit.
There are several codeunits delivered as part of the standard NAV product which are really function libraries. These codeunits consist totally of utility routines, generally organized on some functional basis (for example, associated with Dimensions or with some aspect of Manufacturing or some aspect of Warehouse management). Many of these can be found by filtering the Codeunit Names on the strings "Management" and "Mgt" (the same could be said for some of the tables with the string "Buffer" in their name). Some developers create their own libraries of favorite special functions and include such a function library codeunit in systems on which they work.
If a Codeunit is structured very simply, and can operate in a stand-alone mode, it is feasible to test it in the same way one would test a Report or a Page. Highlight the Codeunit and click on the Run button. The Codeunit will run for a single cycle. However, most codeunits are more complex and must be tested by a calling routine.
Queries are objects whose purpose is to very efficiently create extracted sets of data from the NAV database. NAV 2013 Queries translate directly into T-SQL query statements and run on the server side rather than on the service tier. A Query can extract data from a single table or multiple tables. In the process of extracting data, a Query can do different types of Joins (Inner Join, Outer Join, Cross Join), can filter, can calculate FlowFields (special NAV calculations which are discussed in detail in Chapter 3, Data Types and Fields), can sort, and can create sums and averages. Queries obey the NAV data structure business logic.
The output of a Query can be a CSV file (useful for Excel charts), an XML file (for charts or external applications) or an OData file (for a web service). Queries can be published for web service access similarly to Pages and Codeunits. Query results can also be viewed by Pages and Cues, but are especially powerful when output to charts.
MenuSuites are the objects that are displayed in the Navigation Pane menus. They differ considerably from the other object types we have discussed earlier because they not only have a completely different structure, but they are also maintained differently. MenuSuite entries do not contain triggers. The only customization that can be done with MenuSuites is to add, delete, or edit menu entries which are made up of a small set of properties.
In the Role Tailored Client, the data in the MenuSuites object is presented in the Departments page.
XMLports are a tool for importing and exporting data. XMLports handle both XML-structured data and other external text data formats. XML stands for eXtensible Markup Language and has become the de facto standard for exchanging data between dissimilar systems. For example, XMLports could be used to communicate between our NAV ERP system and our accounting firm's financial analysis and tax preparation system.
XML is designed to be extensible, which means that we can create or extend the definition as long as we communicate the revised XML format to our correspondents. There is a standard set of syntax rules to which XML formats must conform. XML is becoming more and more important because most new software uses XML. For example, the new versions of Microsoft Office are quite XML friendly. All web services communications are in the form of an exchange of XML-structured data.
The non-XML text data files handled by XMLports fall into two categories. One is known as comma separated value or comma delimited files (usually having a .csv file extension). Of course, the delimiters don't actually need to be commas. The other category is fixed format, in which the relative position and length of each field is pre-defined.
XMLports can contain C/AL logic for any type of appropriate data manipulation, either when importing or exporting. Functions such as editing, validating, combining, filtering, and so on, can be applied to the data as it passes through an XMLport.
As with any system where we can do development work, careful attention to documentation and backing up our work is very important. C/SIDE provides a variety of techniques for handling each of these tasks.
When we are working within the Object Designer, we can back up individual objects of any type or groups of objects by exporting them. These exported object files can be imported in total, selectively in groups, or individually, to recover the original version of one or more objects.
When objects are exported to text files, we can use a standard text editor to read or even change them. For example, if we wanted to change all of the instances of the field name Customer to Patient, we might export all of the objects to text and execute a mass Find and Replace. Making such code changes in a text copy of an object is subject to a high probability of error, as we won't have any of the many safety features of the C/SIDE environment to limit what we can do.
Internal documentation (that is, inside C/SIDE) of object changes can be done in three areas. First is the Object Version List, a field attached to every object, visible in the Object Designer screen. Whenever a change is made in an object, a notation should be added to the Version List.
The second area for documentation is the Documentation trigger that appears in every object type except MenuSuites . The Documentation trigger is at the top of the object and is the recommended location for noting a relatively complete description of any changes that have been made to the object. Such descriptions should include a brief description of the purpose of the change as well as technical information.
The third area we can place documentation is inline with modified C/AL code. Individual comment lines can be created by starting the line with double forward slashes //. Whole sections of comments (or commented out code) can be created by starting and ending the section with a pair of curly braces { }. Depending on the type of object, and the nature of the specific changes, we should generally annotate each change inline everywhere it affects the code, so all the changes can be easily identified by the next developer looking at this object.
In short, everything that we learned earlier about good documentation practices applies when doing development in NAV C/SIDE. This holds true whether the development is new work or a modification of existing logic.