Book Image

Administrating Microsoft Dynamics 365 Business Central Online

By : Andrey Baludin
Book Image

Administrating Microsoft Dynamics 365 Business Central Online

By: Andrey Baludin

Overview of this book

This book features all the information you need to get started with administrating Microsoft Dynamics 365 Business Central Online. It contains detailed information about the admin portal and cloud migration process, all based on real usage experience. The book starts by covering the data migration process for developers, which will show you how to organize the data without code. You’ll also learn how the admin portal can be useful if you want to export a database copy, restore a backup, and set up telemetry to get detailed information about the call stack and operation statuses. As you progress, you’ll learn how to check your Business Central SaaS environment details, create new and different types of environments, and notifications, and keep your cloud data within limits. Later, you’ll explore how to set up cloud migration from an on-premise environment to SaaS, run the migration, upgrade data, and fix problems if something goes wrong. By the end of this book, you’ll be able to create new production and sandbox environments, restore them from backups, analyze environment telemetry, and confidently migrate your data to the cloud.
Table of Contents (15 chapters)
1
Part 1: Dynamics 365 Business Central Admin Center
9
Part 2: Dynamics 365 Business Central Cloud Migration Tool

Analyzing telemetry

In this section, we will learn how to find the requisite events with KQL and create telemetry alerts.

Let's open Application Insights in the Azure portal, select Logs, and open the query window. Start printing and just select variants from the drop-down menu.

First of all, we can check our logs for errors. Severity levels in Application Insights have different values than in the Admin portal.

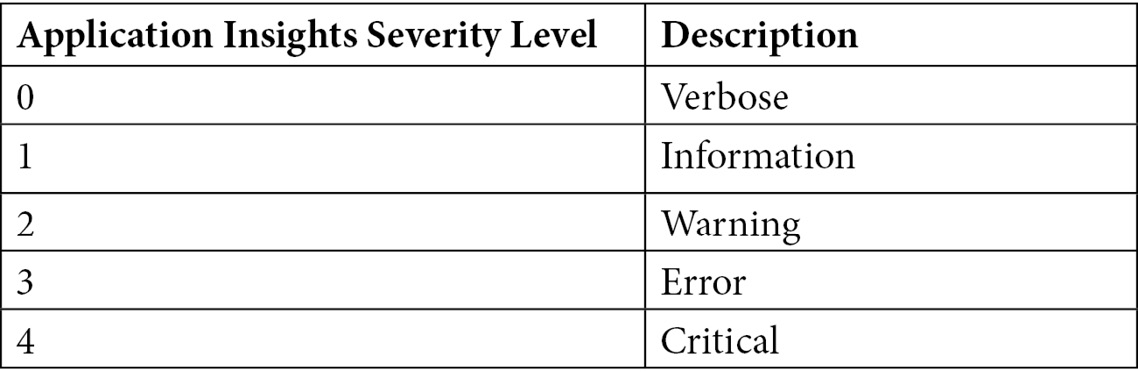
To find the errors, we need to select traces according to the third severity level. Therefore, print traces and press Enter. The new line will start with the | symbol. Print where severityLevel == 3. Choose the time interval that you want to analyze. You should get something like this:

Figure 4.18 – KQL query sample

Expand the record and check for the customDimensions element. Here you can see many important values, such as TenantId (if you collect the telemetry for different tenants), environmentName, and...