

Reviewing existing selected process master shapes
If we click the Edit Master Shape … option in the right-click menu of the Process master in our Document Stencil area, we will see that the Shape Data section looks like this:
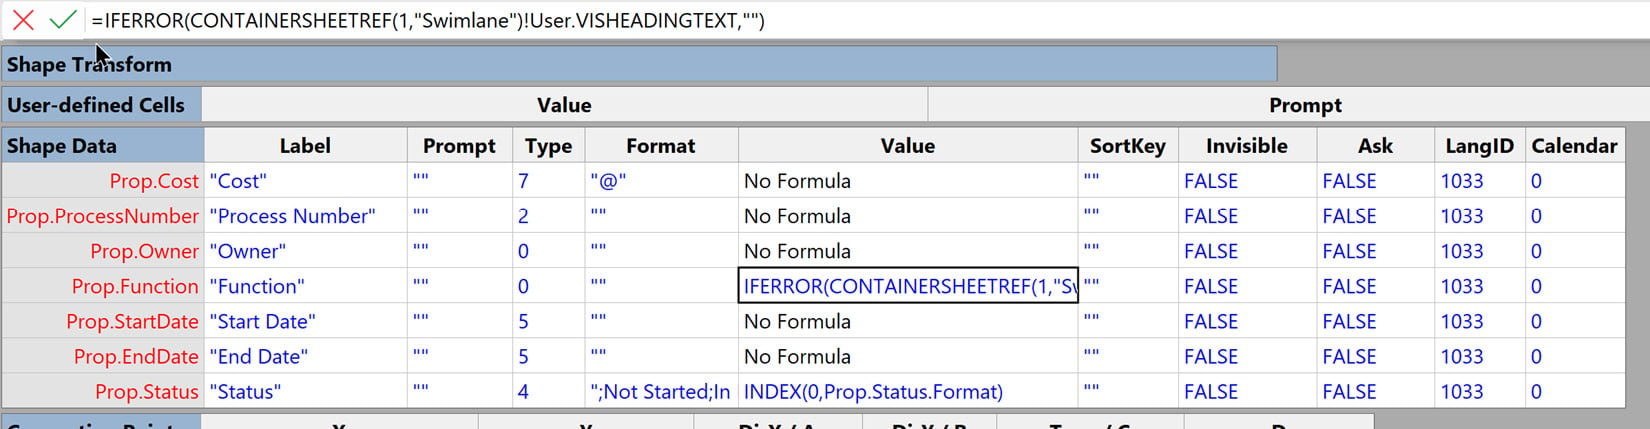
Figure 10.10 – The Shape Data section of a Process shape
The first thing we should notice is that the formulas are all blue text, whereas they were black in Figure 10.10. This is because inherited formulas and values are colored black but those that are not inherited are colored blue.
Hopefully, you have noticed that this section defines what is displayed in the Shape Data window. This is an optional section of the ShapeSheet, which means that it does not exist on all shapes, unlike some other sections that need to exist for Visio to work and cannot be deleted. The Shape Data section used to be called Custom Properties originally (and referred to as Prop in formulas) and can have many rows, which can be named for...