

Adding description shape data to existing master shapes
The flowchart shapes are normally labeled with a terse description of the action that is needed, but we do not have a built-in Shape Data row to enter a longer description. There is a ScreenTip available on the Insert | Text ribbon group, which can be used to add multi-line text to each shape that appears when we hover the mouse over it. However, this text does not appear in a Shape Data row, so we cannot enter this text easily in the Shape Data window, nor can we easily extract it with reports or display it in Data Graphics.
Fortunately, we can create a new Shape Data row – let’s call it Description – by using the ShapeSheet Design | Rows | Insert ribbon command, or the right-click menu’s Insert Row command within the Shape Data section, as shown in the following screenshot:
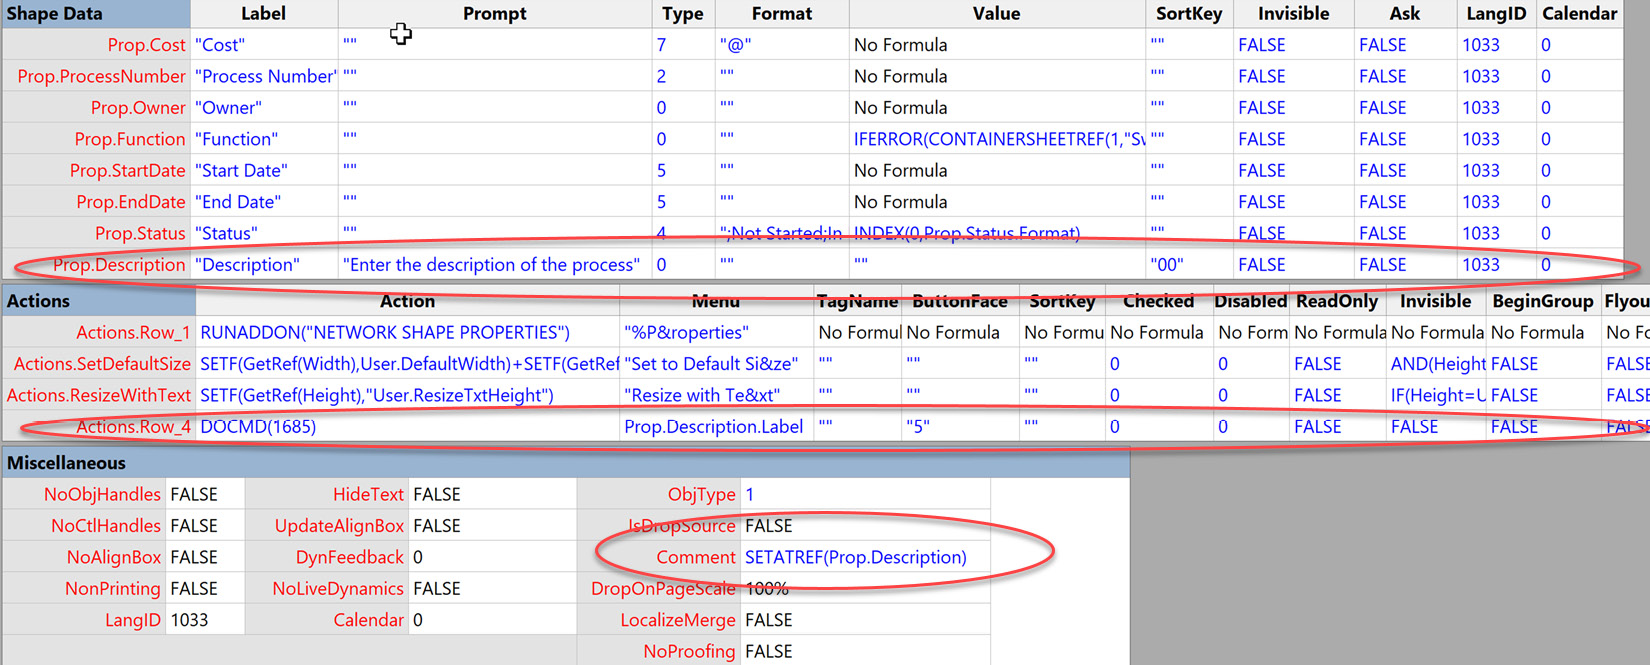
Figure 10.11 – Adding a Description Shape Data row
Notice that we have added "Description...