

Relating shapes to each other
There is a Line option in the Insert or Home | Draw Shape drop-down menus in the browser edition. Although this can be used to glue to shapes and connection points, the line does not have the same capabilities as the connector line drawn by the AutoConnect arrow because it does not have any automatic routing capabilities, nor does its text box have a control handle to reposition it. The text rotates with the line rather than staying horizontal. For these reasons, it is always best to use the AutoConnect arrow to make connections between flowchart shapes because it will create an instance of the dynamic connector master shape. We can also use the Home | Tools | Connector or Insert | Diagram Parts | Connector commands in Visio desktop to create a connector between two shapes, which also uses the dynamic connector master:
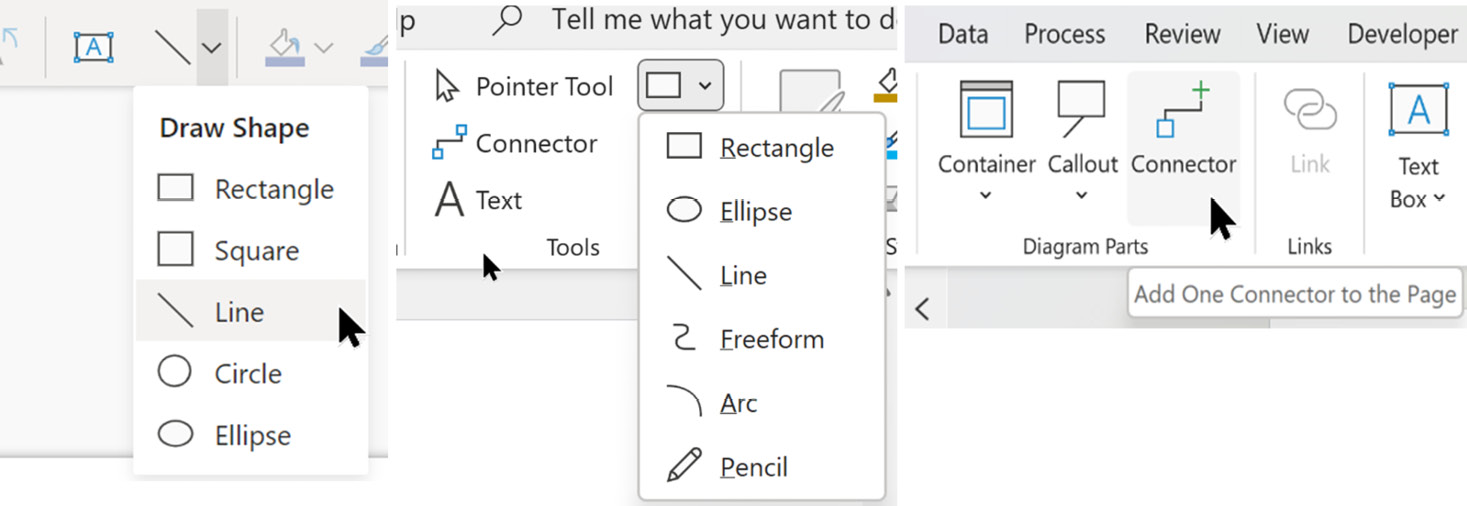
Figure 3.9 – The Visio web Draw Shape menu and the Visio desktop Tools and Diagram Parts groups
So...