

Adding extra information to process steps
One of the best features of Visio Plan 2 is the ability to link data to shapes. So, even if we do not use Data Visualizer to create process flowcharts automatically, we can add data to shapes from a variety of data sources. This capability is covered in the book Mastering Data Visualization with Microsoft Visio Professional 2016 by Packt, and this is still current for Visio Professional and Visio Plan 2. This technique can also be used to enhance diagrams created by Data Visualizer.
For example, if we create another Excel table with a column name that matches a unique identifier of the process flowchart shapes in the diagram, then we can link more data, including hyperlinks, to specific shapes. In this example, we have used the Process Number column and added a Url column that contains more information:
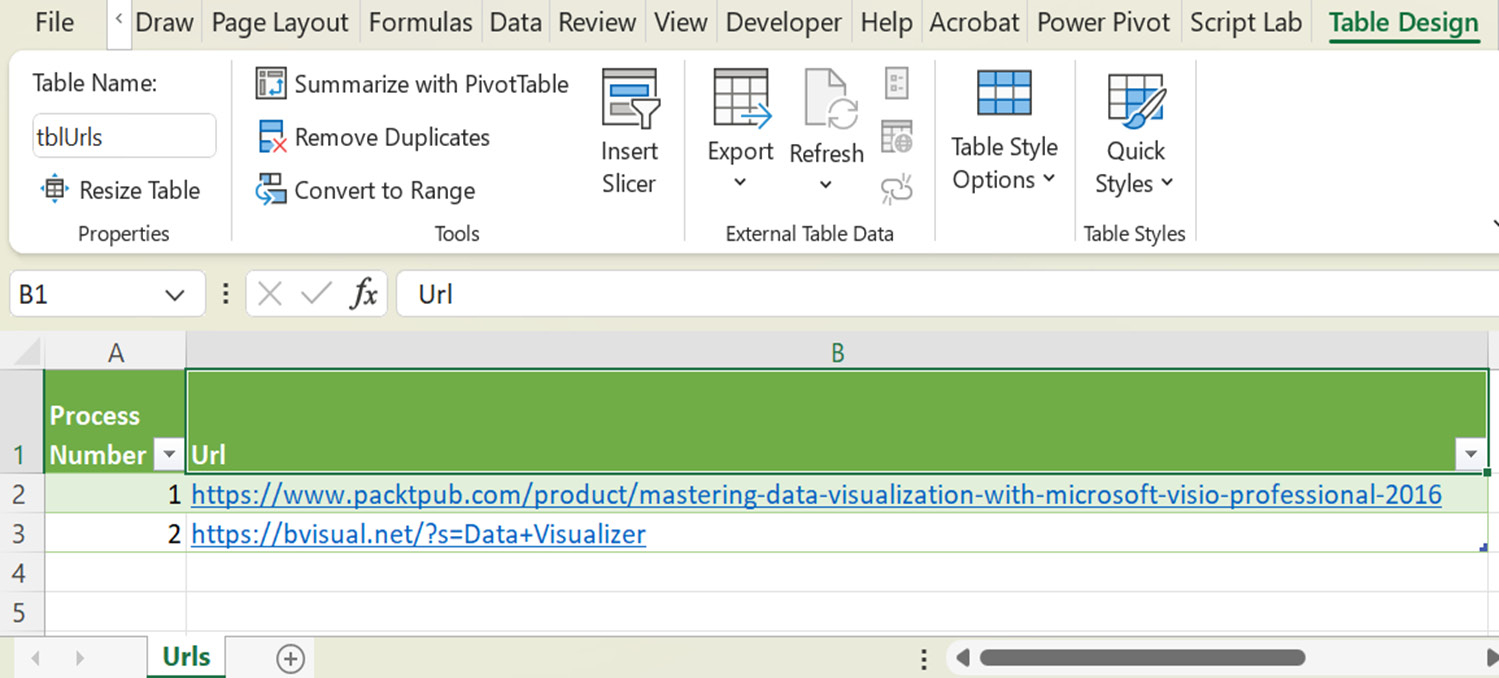
Figure 5.27 – An Excel table with extra information
The Data | External Data | Custom Import button...