Book Image

Microsoft Power Platform Functional Consultant: PL-200 Exam Guide

By : Julian Sharp
Book Image

Microsoft Power Platform Functional Consultant: PL-200 Exam Guide

By: Julian Sharp

Overview of this book

The Power Platform Functional Consultant Associate (PL-200) exam tests and validates the practical skills of Power Platform users who are proficient in developing solutions by combining the tools in Power Platform and the Microsoft 365 ecosystem based on business needs. This certification guide offers complete, up-to-date coverage of the PL-200 exam so you can prepare effectively for the exam. Written in a clear, succinct way with self-assessment questions, exam tips, and mock exams with detailed explanations of solutions, this book covers common day-to-day activities involved in configuring Power Platform, such as managing entities, creating apps, implementing security, and managing system change. You'll also explore the role of a functional consultant in creating a data model in the Microsoft Dataverse (formerly Common Data Service). Moving ahead, you'll learn how to design the user experience and even build model-driven and canvas apps. As you progress, the book will show you how to manage automation and create chatbots. Finally, you'll understand how to display your data with Power BI and integrate Power Platform with Microsoft 365 and Microsoft Teams. By the end of this book, you'll be well-versed with the essential concepts and techniques required to prepare for the PL-200 certification exam.
Table of Contents (34 chapters)
1
Section 1: Introduction
3
Section 2: Microsoft Dataverse
11
Section 3: Power Apps
15
Section 4: Automation
19
Section 5: Power Virtual Agents
22
Section 6: Integrations

Creating a chart

You can create a new chart from the Charts tab of the entity in your solution by clicking Add chart, as shown in Figure 9.28. This opens the chart designer, as shown in the following screenshot:

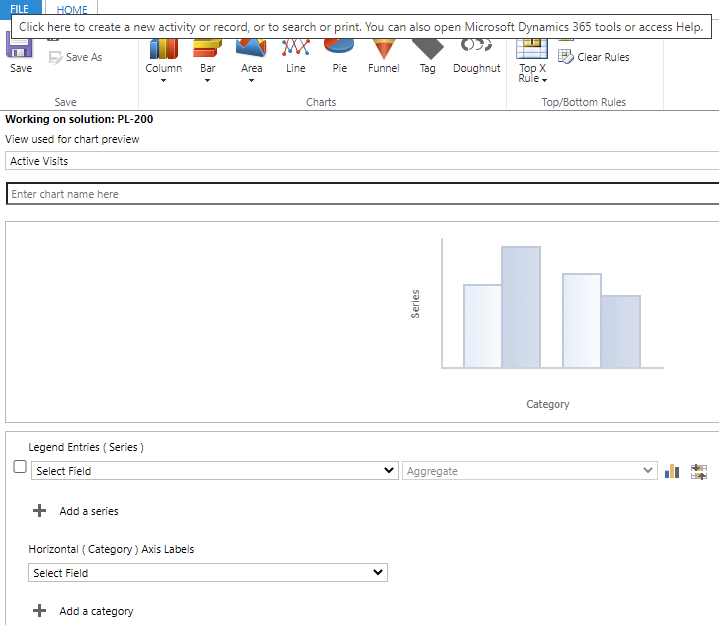
Figure 9.28 – Chart designer

In the previous screenshot, you can configure the following:

  • View used for chart preview: You can use any public view to select the records to be used in the chart. The view is not saved with the chart definition. It is just for illustration.
  • Chart type: Click on the type of chart. You can change this at any time.
  • Name: This will be populated automatically from the fields selected.
  • SeriesThe field(s) you want to aggregate (summarize).
  • Aggregate: The function you want to aggregate with.
  • CategoriesThe field(s) that you want to group the data by. If you use a date field, then you can group by day, week, month, quarter, and year.

If you have multiple series in your chart, you can have different chart types for each...