Packet analysis is a technique that’s used by both networking and cybersecurity professionals to see what’s happening within their networks. Many protocol analyzer applications allow professionals to capture network traffic and analyze the state of the network. Network professionals use protocol analyzers to identify the type of traffic, whether any issues are occurring, and to assist with troubleshooting.
In this section, you will gain hands-on experience with Wireshark, a popular network protocol analyzer for identifying the fields within network packets. To get started with this exercise, follow these steps:
- First, go to https://www.wireshark.org/download.html to download the latest version of Wireshark on your computer. Once the download is complete, start the installation process and use the default options when installing the application onto your computer. Ensure you install the PCAP driver when prompted.
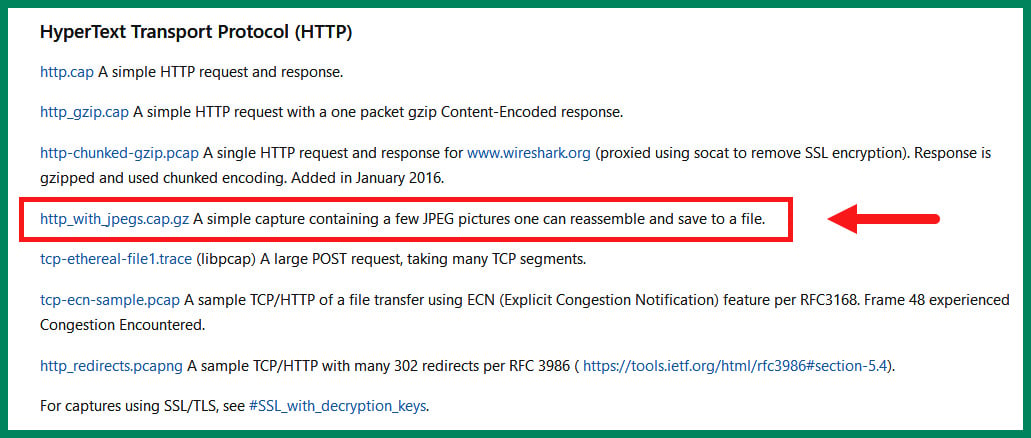
- We’ll be using a sample capture file within this exercise. To download the sample file for this exercise, go to https://wiki.wireshark.org/SampleCaptures and download the
http_with_jpegs.cap.gz file, as shown in the following screenshot:
Figure 1.28 – Sample capture file
- Next, open the Wireshark application on your computer, click on File | Open, and select the
http_with_jpegs.cap.gz file that you downloaded in the previous step. Once the file has opened within Wireshark, you’ll see all the packets and their contents, as shown in the following screenshot:
Figure 1.29 – Wireshark user interface
As shown in the preceding screenshot, the upper pane is known as the Packet List pane, which shows all the packets, the packet number, the absolute time from the point the capture started, the source and destination IP addresses, protocols, packet lengths, and summary information. The lower pane is known as the Packet Details pane. When you select a packet, the details and contents of the packet are shown here. There is a third pane called Packet Bytes that is displayed at the bottom of Wireshark. We will not be showing this pane in this example.
- Next, select packet #1 from the Packet Details pane and expand the Ethernet (or Ethernet II) header, as shown in the following screenshot:
Figure 1.30 – Packet #1 Ethernet header
As we can see, the Ethernet header contains the source and destination MAC addresses, as well as the protocol type of the upper layer (Network/Internet layer).
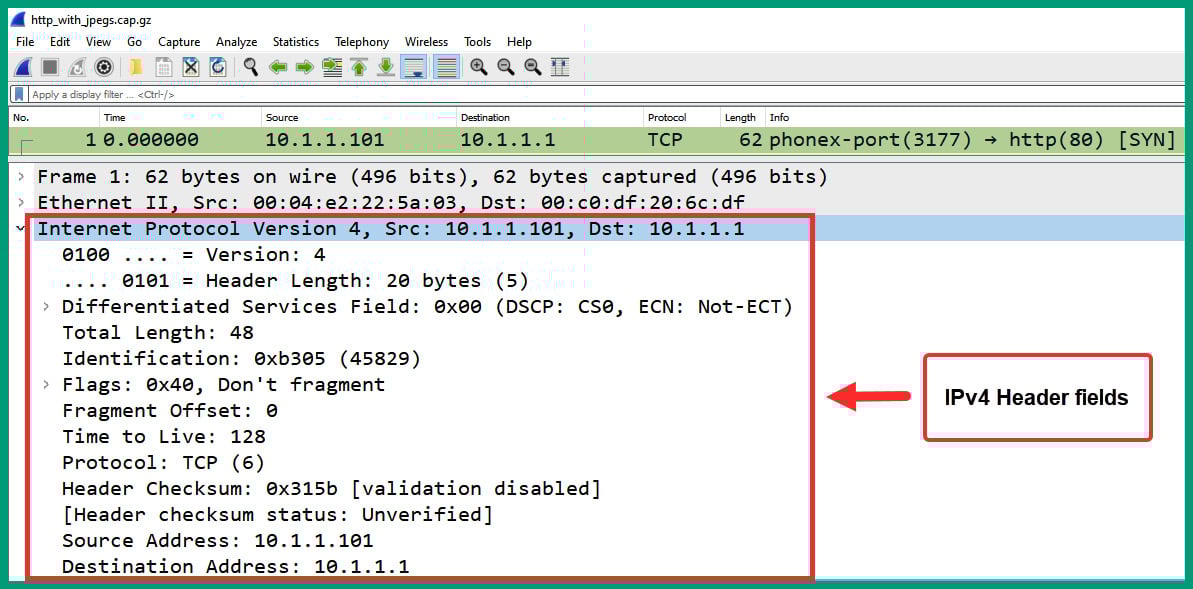
- Next, expand the Internet Protocol header of packet #1 to view the IP header and its contents, as shown in the following screenshot:
Figure 1.31 – Packet #1 IP header
As we can see, the IP header shows the version, Differentiated Services fields, total length, source and destination IP addresses, and all their fields.
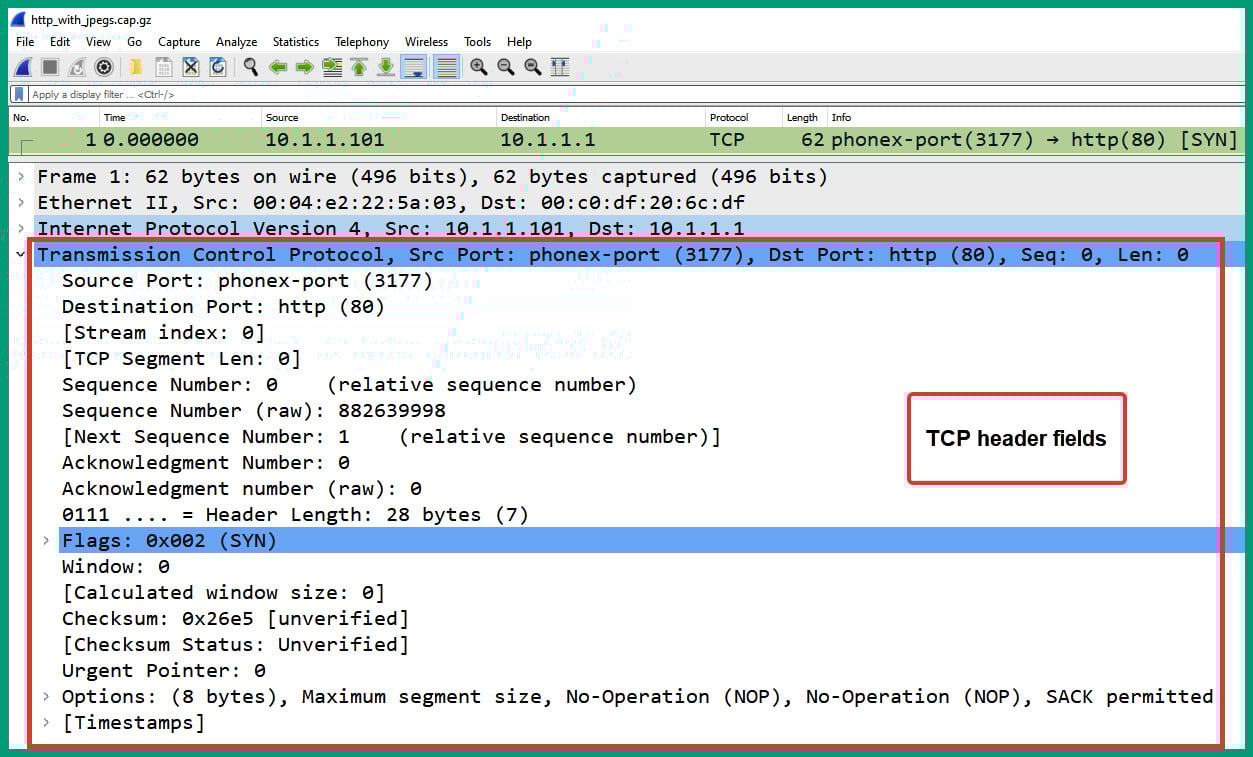
- Next, expand the Transmission Control Protocol header of packet #1 to display its fields, as shown in the following screenshot:
Figure 1.32 – Packet #1 TCP header
As we can see, the TCP header contains the source and destination service port numbers, TCP flag (SYN), sequence numbers, and so on. Notice that Wireshark automatically resolves the application layer protocol based on the service port number.
Important note
If Wireshark does not automatically resolve public IP addresses to hostnames or service port numbers to application layer protocols, simply enable the resolution features by selecting Edit | Preferences | Name Resolution to enable Resolve MAC addresses, Resolve transport names, and Resolve network (IP) addresses.
- Next, select packet #2 from the Packet Details pane and expand the Ethernet header, as shown in the following screenshot:
Figure 1.33 – Packet #2 Ethernet header
As we can see, the source and destination MAC addresses are now in reverse order.
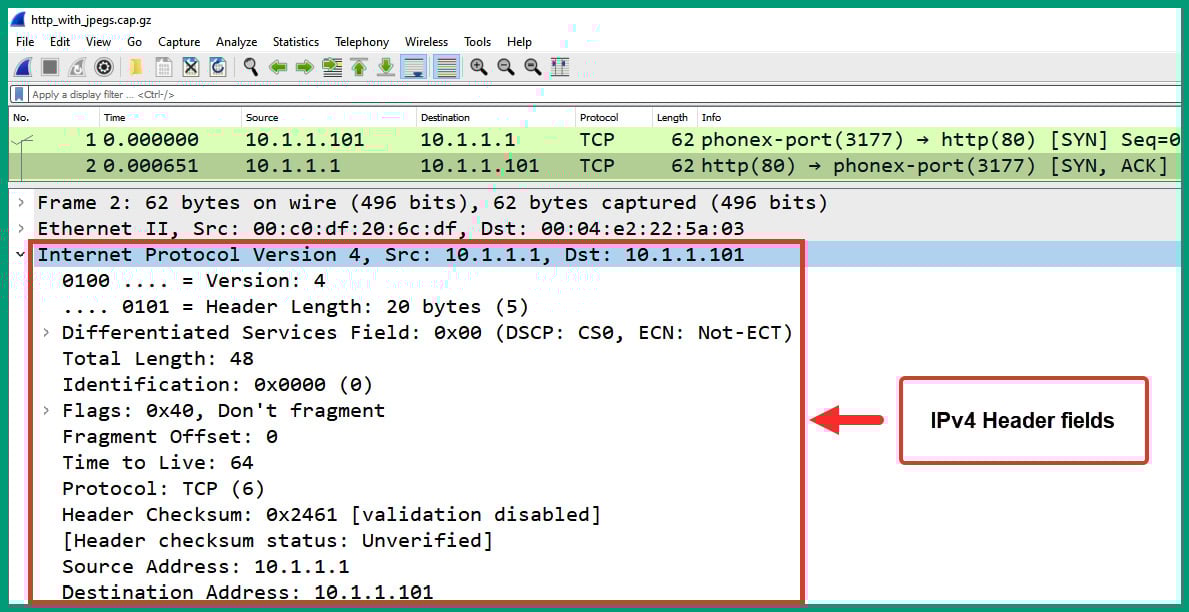
- Next, expand the Internet Protocol header of packet #2 to view the IP header and its contents, as shown in the following screenshot:
Figure 1.34 – Packet #1 IP header
As we can see, the source and destination IPv4 addresses are in reverse order as the web server is responding to the client.
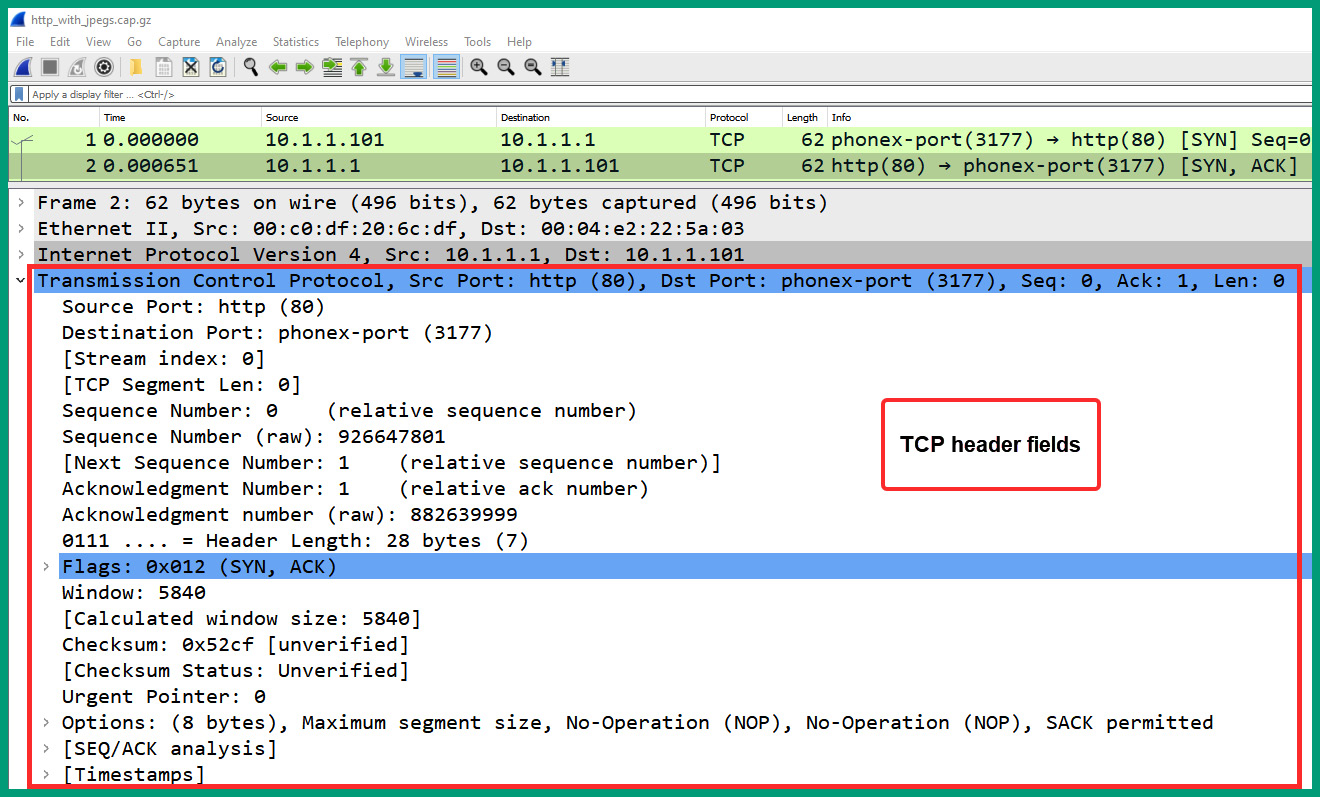
- Next, expand the Transmission Control Protocol header of packet #2 to display its fields, as shown in the following screenshot:
Figure 1.35 – Packet #2 TCP header
As we can see, the source and destination service ports are reversed compared to packet #1. The TCP flag indicates that packet #2 is a SYN/ACK response.
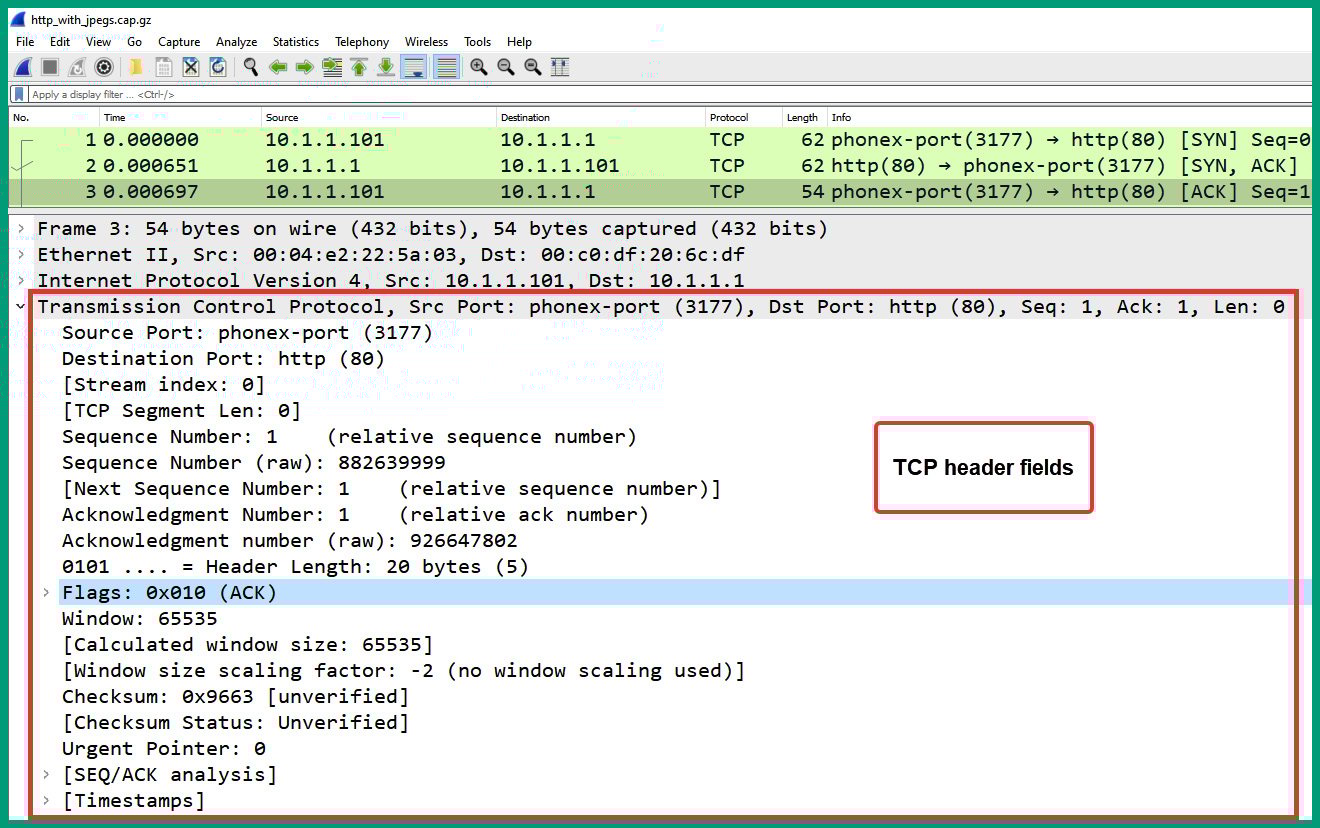
- Next, select packet #3 and expand the Transmission Control Protocol header, as shown in the following screenshot:
Figure 1.36 – Packet #3 TCP header
As we can see, packet #3 is a TCP ACK that is used to establish the TCP three-way handshake between 10.1.1.101 and 10.1.1.1.
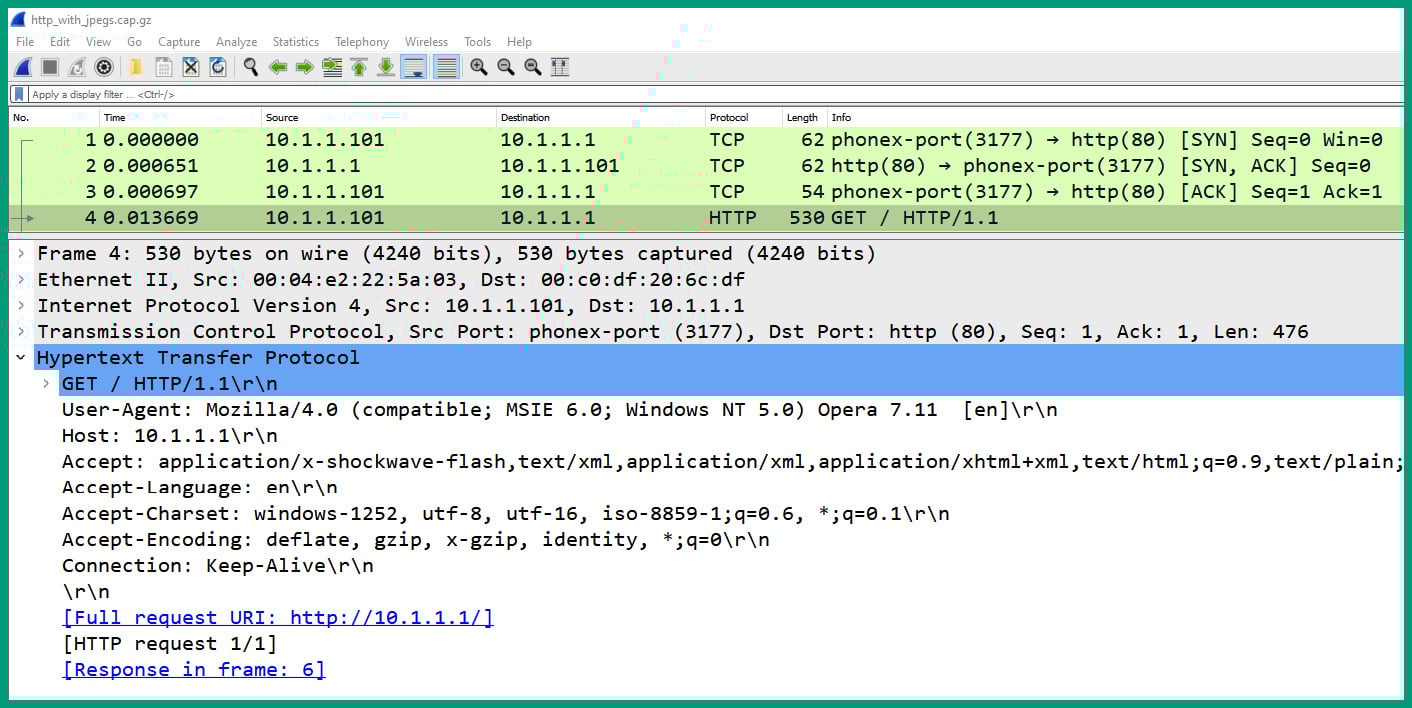
- Next, select packet #4 and expand the Hypertext Transfer Protocol header, as shown in the following screenshot:
Figure 1.37 – Packet #4 HTTP header
As shown in the preceding snippet, packet #4 is sent from the client device (10.1.1.101) to the web server (10.1.1.1) and Wireshark shows the contents of the application layer protocol (HTTP).
Important note
HTTP is an unsecure protocol that does not provide any security such as data encryption. This means that anyone can view its contents using a protocol analyzer application.
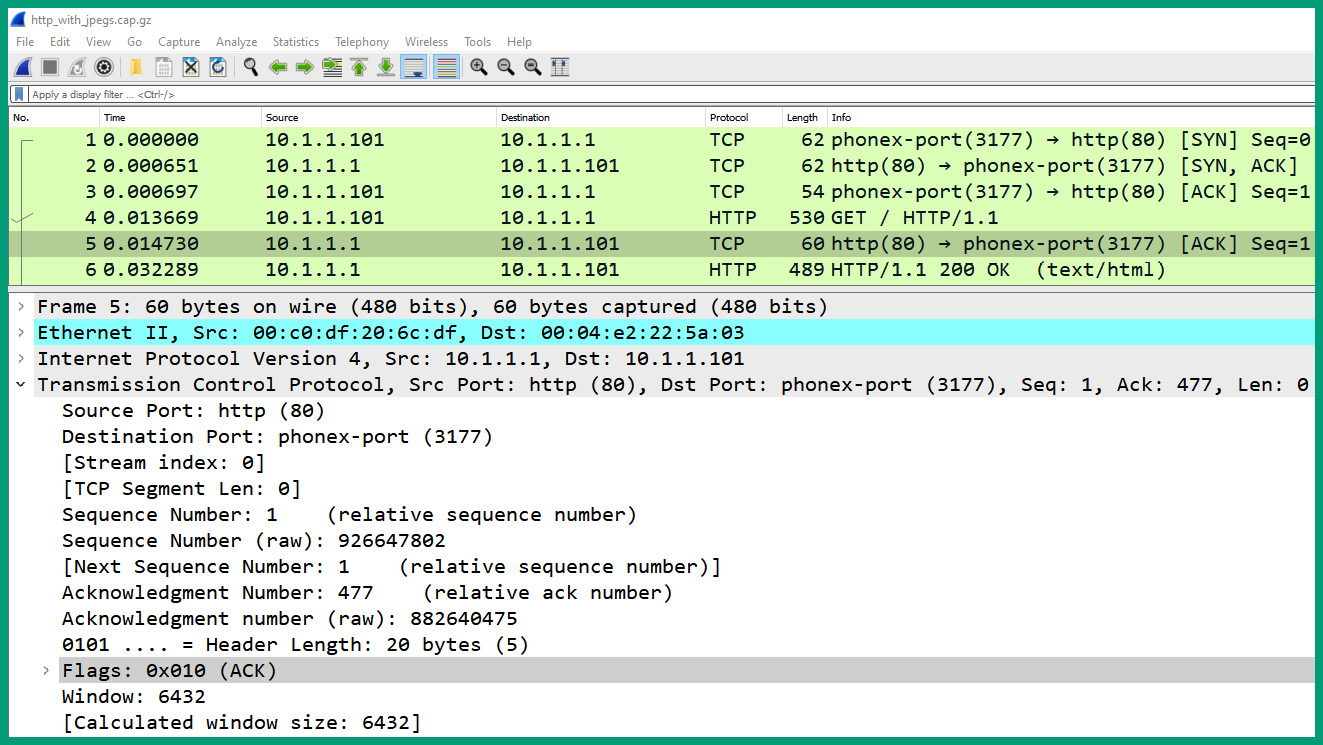
- Next, select packet #5 and expand the Transmission Control Protocol header, as shown in the following screenshot:
Figure 1.38 – Packet #5 TCP header
As we can see, packet #5 is a TCP ACK packet that is sent from the web server to the client, indicating that the HTTP message was received.
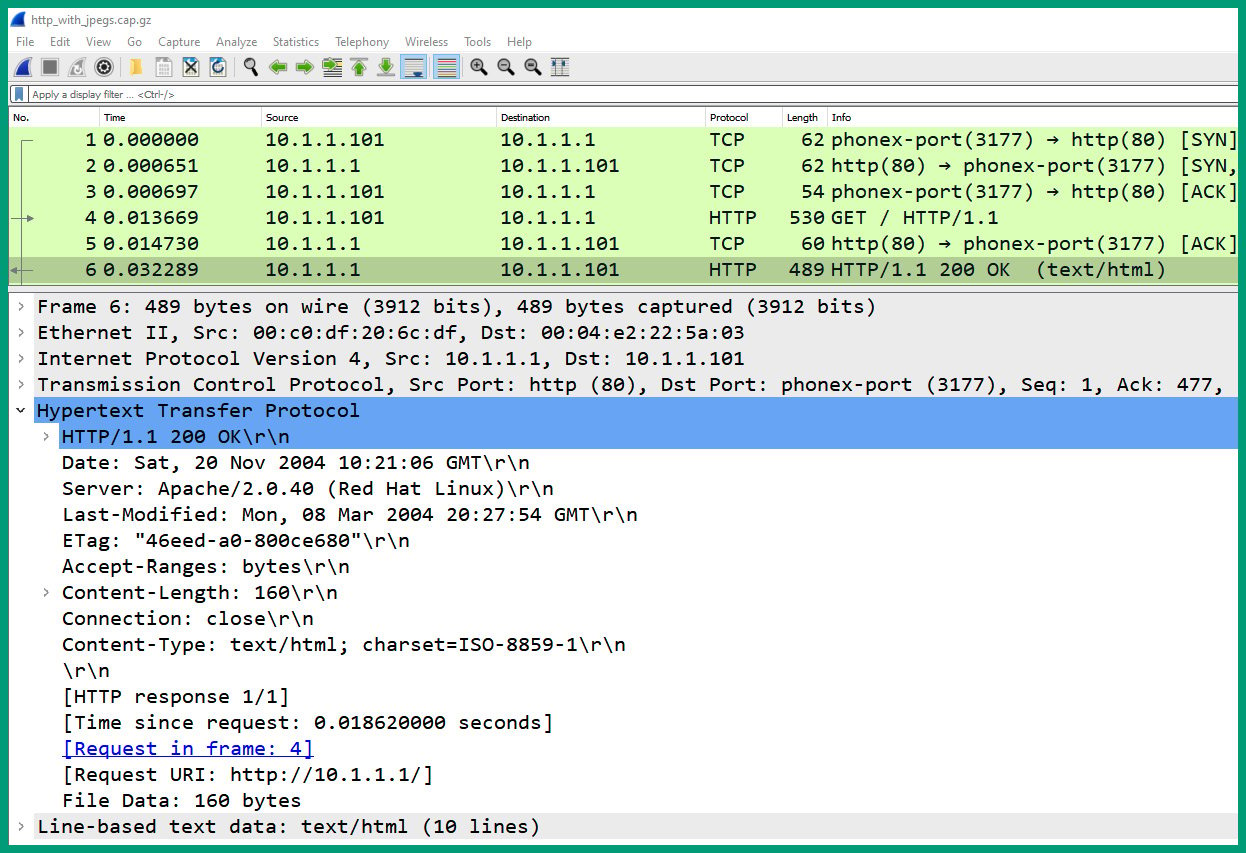
- Next, select packet #6 and expand the Hypertext Transfer Protocol header, as shown in the following screenshot:
Figure 1.39 – Packet #6 HTTP header
As we can see, the response from the web server is visible using Wireshark.
Having completed this section, you have gained hands-on skills with Wireshark to identify the fields and their values within network packets.


 Free Chapter

