-
Book Overview & Buying
-
Table Of Contents

Zenoss Core 3.x Network and System Monitoring
By :
Zenoss Core 3.x Network and System Monitoring
By:
Overview of this book
For system administrators, network engineers, and security analysts, it is essential to keep a track of network traffic.
Zenoss Core is an enterprise-level systems and network monitoring solution that can be as complex as you need it to be. And while just about anyone can install it, turn it on, and monitor "something", Zenoss Core has a complicated interface packed with features. The interface has been drastically improved over version 2, but it's still not the type of software you can use intuitively – in other words, a bit of guidance is in order.
The role of this book is to serve as your Zenoss Core tour guide and save you hours, days, maybe weeks of time.
This book will show you how to work with Zenoss and effectively adapt Zenoss for System and Network monitoring. Starting with the Zenoss basics, it requires no existing knowledge of systems management, and whether or not you can recite MIB trees and OIDs from memory is irrelevant. Advanced users will be able to identify ways in which they can customize the system to do more, while less advanced users will appreciate the ease of use Zenoss provides. The book contains step-by-step examples to demonstrate Zenoss Core's capabilities. The best approach to using this book is to sit down with Zenoss and apply the examples found in these pages to your system.
The book covers the monitoring basics: adding devices, monitoring for availability and performance, processing events, and reviewing reports. It also dives into more advanced customizations, such as custom device reports, external event handling (for example, syslog server, zensendevent, and Windows Event Logs), custom monitoring templates using SNMP data sources, along with Nagios, and Cacti plugins. An example of a Nagios-style plugin is included and the book shows you where to get an example of a Cacti-compatible plugin for use as a command data source in monitoring templates. In Zenoss Core, ZenPacks are modules that add monitoring functionality. Using the Nagios plugin example, you will learn how to create, package, and distribute a ZenPack. You also learn how to explore Zenoss Core's data model using zendmd so that you can more effectively write event transformations and custom device reports.
Table of Contents (21 chapters)
Zenoss Core 3.x Network and System Monitoring

Credits
About the Author
About the Reviewers
www.PacktPub.com
Preface
 Free Chapter
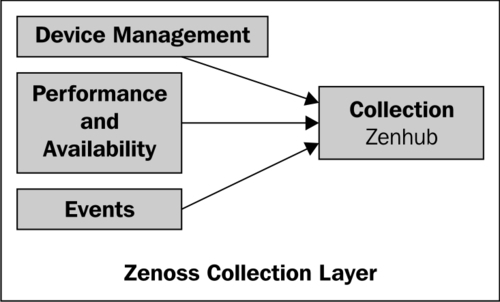
Network and System Monitoring with Zenoss Core
Discovering Devices
Device Setup and Administration
Monitor Status and Performance
Custom Monitoring Templates
Core Event Management
Collecting Events
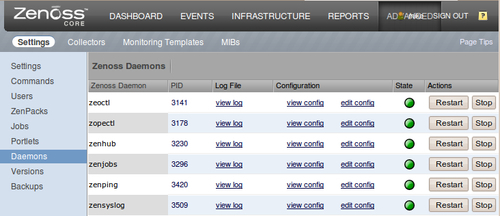
Settings and Administration
Extending Zenoss Core with ZenPacks
Reviewing Built-in Reports
Writing Custom Device Reports
Event Attributes
Device Attributes
Example snmpd.conf
Index