
In this recipe, we will use ARM (Application Rule Manager) in NSX 6.3 to collect flows from multiple virtual machines, analyze them, and create a firewall rules based on the collected flows.
You will need to have the following access and configurations present before proceeding with this recipe:
- Access to the vSphere Web Client
- NSX administrator or enterprise administrator access
Let's start a monitoring session from ARM to collect traffic flows from a three-tier application virtual machine:
- Log in to the
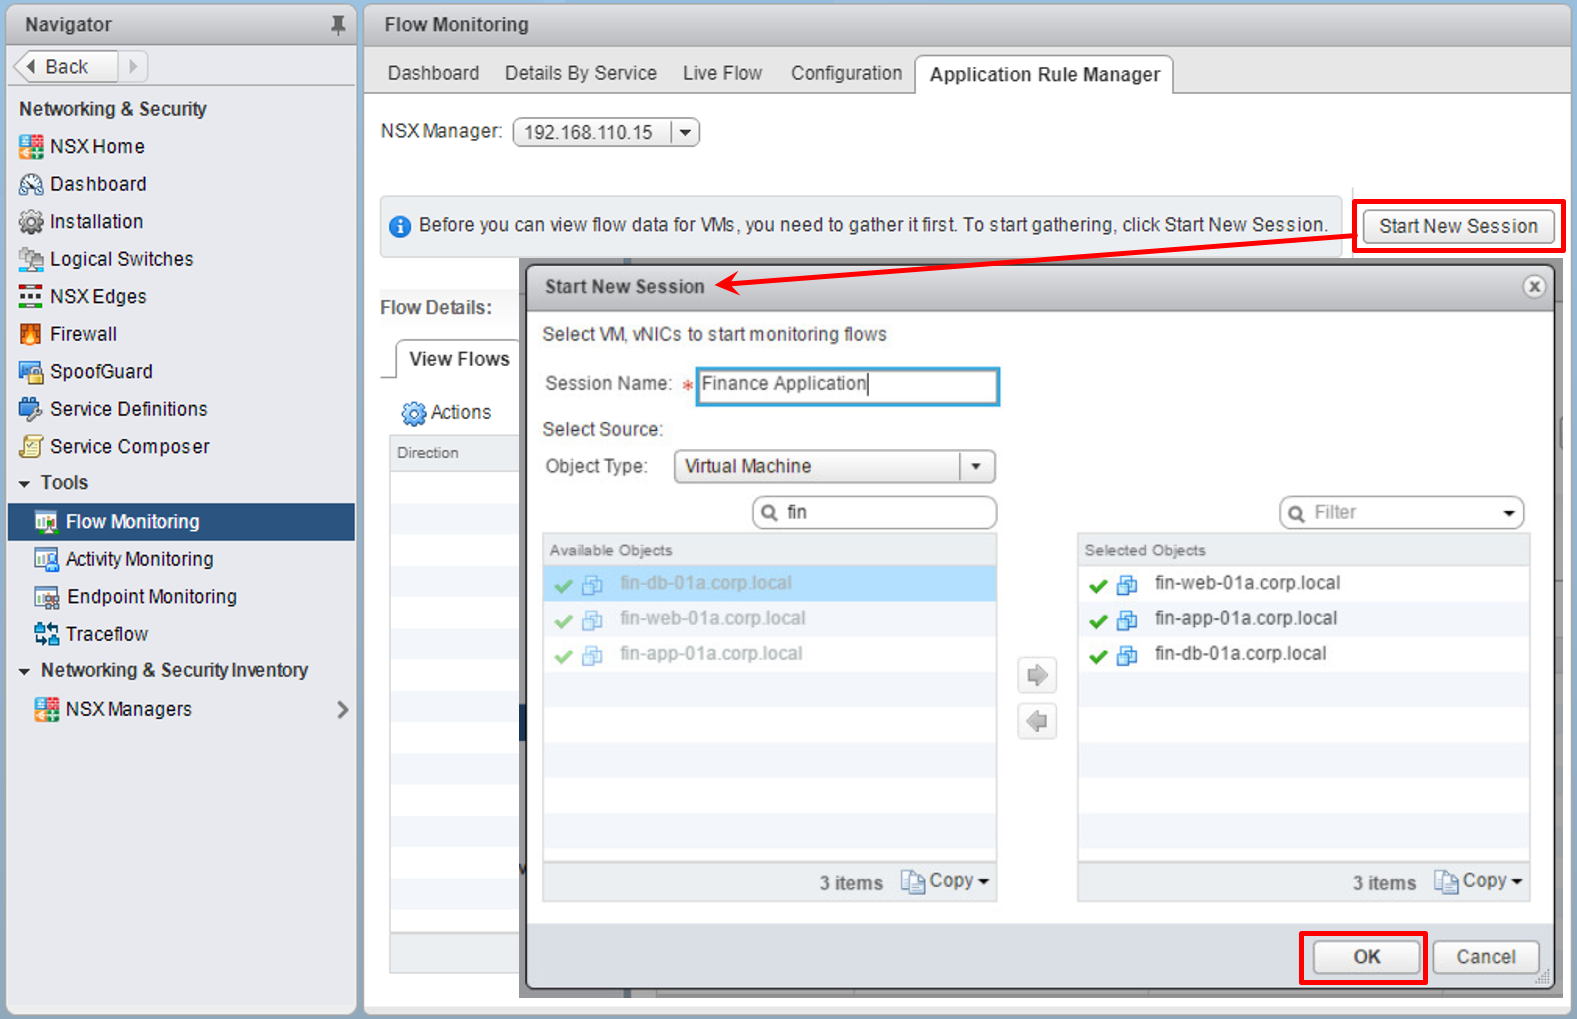
vSphere Web ClientUI and navigate toHome|Networking & Security|Flow Monitoring. In the center pane, select theApplication Rule Managertab and click on theStart New Sessionbutton on the right. Type the session name and select the object type that you want to monitor with ARM. This can be a virtual machine:
- Wait for few minutes. If there are traffic flows on the monitored objects, ARM will detect how many sources and flows...