

Zabbix can be defined as a distributed monitoring system with a centralized web interface (on which we can manage almost everything). Among its main features, we will highlight the following ones:
It has a centralized web interface
The server can be run on most Unix-like operating systems
We can use native agents for most of the Unix, Unix-like, and Microsoft Windows operation systems
It has an extremely flexible configuration
It is easy to integrate with other systems
It can be monitored via SNMP (v1, v2, and v3), IPMI, JMX, ODBC, and SSH
It gives us a possibility to create custom items, graphs, and interpolate data
It is easy to customize

The Zabbix architecture for a large environment is composed of three different servers/components (that should be configured on HA as well). These three components are as follows:
The whole Zabbix infrastructure in large environments allows us to have two other actors that play a fundamental role. These actors are the Zabbix agents and the Zabbix proxies.
An example is represented in the following figure:

On this infrastructure, we have a centralized Zabbix server that is connected to different proxies, usually one for each server farm or a subnetwork.
The Zabbix server will acquire data from Zabbix proxies and the proxies will acquire data from all the Zabbix agents connected to it, all the data is stored on a dedicated RDBMS, and the frontend is exposed with a web interface to the users. Looking at the technologies used, we see that the web interface is written in PHP and the server, proxies, and agents are written in C.
Note
The server, proxies, and agents are written in C to give the best performance and less resource usage possible. All the components are deeply optimized to achieve the best performance.
We can implement different kinds of architecture using proxies. There are several type of architectures and in order of complexity we find:
The single server installation is not suggested on a large environment. It is the basic installation where single servers do the monitoring and it can be considered a good starting point.
Most probably, in our infrastructure, we might already have a Zabbix installation. Zabbix is quite flexible and this permits us to upgrade this installation to the next step: proxy-based monitoring.
Proxy-based monitoring is implemented with one Zabbix server and several proxies, that is one proxy per branch or datacenter. This configuration is easy to maintain and offers an advantage to have a centralized monitoring solution. This kind of configuration is the right balance between large environment monitoring and complexity. From this point, we can (with a lot of effort) expand our installation to a complete and distributed monitoring architecture. The installation composed by one server and many proxies is the one shown in the previous diagram.
The distributed scenarios are the most complex installation that we can implement with Zabbix. This scenario is composed of one Zabbix server per branch (or datacenter). This installation is the most complex to set up and maintain and unfortunately is not centralized but can be combined with proxies.
All the possible Zabbix architecture will be discussed in detail in Chapter 2, Distributed Monitoring.
The installation that will be covered in this chapter is the one composed by a server for each of the following base components:
A web frontend
A Zabbix server
A Zabbix database
We will start describing this installation because:
It is a basic installation that is ready to be expanded with proxies and nodes
Each component is on a dedicated server
This kind of configuration is the starting point for monitoring large environments
It is widely used
Most probably it will be the starting point of your upgrade and expansion of monitoring infrastructure.
Actually, this first setup for a large environment, as explained here, can be useful if you have the task to improve an existing monitoring infrastructure. If your current monitoring solution is not implemented in this way, the first thing is to plan the migration on three different dedicated servers.
Once the environment is set up on three tiers, but is still giving poor performance, you can plan and think which kind of large environment setup will be a perfect fit for your infrastructure.
When you monitor your large environment, there are some points to consider:
Use a dedicated server to keep the things easy-to-extend
Easy-to-extend and implement a high availability setup
Easy-to-extend an implement a fault tolerant architecture
On this three-layer installation, the CPU usage of server component will not be really critical, at least for the Zabbix server. The CPU consumption is directly related to the number of items to store and the refresh rate (number of samples per minute) rather than the memory.
Indeed the Zabbix server will not consume excessive CPU but is a bit more greedy of memory. We can consider that a quad core server and 4 GB of RAM can be used for more than 1000 hosts without any issues.
Basically, there are two ways to install Zabbix:
Downloading the latest source code and compiling it
Installing it from packages
There is also another way to have a Zabbix server up and running, that is by downloading the virtual appliance but we don't consider this case as it is better to have full control of our installation and be aware of all the steps.
The installation from packages gives us the following benefits:
It makes the process of upgrading and updating easier
Dependencies are automatically sorted
The source code compilation also gives us some benefit:
We can compile only the required features
We can statically build the agent and deploy it on different Linux "flavors"
We can have complete control on the update
It is quite usual to have different versions of Linux, Unix, and Microsoft Windows on a large environment. These kind of scenarios are quite diffused on a heterogeneous infrastructure; and if we use the agent distribution package of Zabbix on each Linux server, we will for sure have different versions of the agent and different locations for the configuration files.
The more standardized we are across the server, the easier it will be to maintain and upgrade the infrastructure. --enable-static give us a way to standardize the agent across different Linux versions and releases and this is a strong benefit. The agent if statically compiled can be easily deployed everywhere and for sure we will have the same location (and we can use the same configuration file apart from the node name) for the agent and his configuration file. The deployment will be standardized; however, the only thing that may vary is the start/stop script and how to register it on the right init runlevel.
The same kind of concept can be applied to commercial Unix bearing in mind its compilation by vendors, so the same agent can be deployed on different versions Unix release by the same vendor.
Before compiling Zabbix, we need to take a look at the prerequisites. The web frontend will need at least the following version:
Apache (1.3.12 or later)
PHP (5.1.6 or later )
Instead, the Zabbix server will need:
An RDBMS – The open source alternatives are PostgreSQL and MySQL
zlib-devel
mysql-devel – It is used for supporting MySQL (not needed on our setup)
postgresql-devel – It is used for supporting PostgreSQL
glibc-devel
curl-devel – It is used on web monitoring
libidn-devel – The curl-devel depends on it
openssl-devel – The curl-devel depends on it
net-snmp-devel – It is used on SNMP support
popt-devel – The net-snmp-devel might depend on it
rpm-devel – The net-snmp-devel might depend on it
OpenIPMI-devel – It is used for supporting IPMI
iksemel-devel – it is used for jabber protocol
Libssh2-devel
sqlite3 – It is required if SQLite is used as Zabbix backend database (usually on proxies)
On a Red Hat Enterprise Linux distribution, to install all the dependencies, we can use yum (from root) and install the following package:
yum install zlib-devel postgresql-devel glibc-devel curl-devel gcc automake postgresql libidn-devel openssl-devel net-snmp-devel rpm-devel OpenIPMI-devel iksemel-devel libssh2-devel openldap-devel
Tip
iksemel-devel is used to send a Jabber message. This is a really useful feature as it enables Zabbix to send chat messages. Furthermore, Jabber is managed as a media type on Zabbix and you can also set your working time, which is a really useful feature to avoid the sending of messages when you are not in office.
Zabbix needs a user and an unprivileged account to run. Anyway, if the daemon is started from root, it will automatically switch to the Zabbix account if this one is present.
# groupadd zabbix
# useradd –m –s /bin/bash -g zabbix zabbix
# useradd –m –s /bin/bash -g zabbix zabbixsvr
The preceding lines permit you to enforce the security of your installation. The server and agent should run with two different accounts otherwise the agent can access Zabbix server's configuration. Now, using the Zabbix user account we can extract the tar.gz file:
# tar -zxvf zabbix-2.0.6.tar.gz
To know all the possible configuration options you can check use the --help parameter as follows
# ./configure -–help
To configure the source for our server, we can use the following options:
# ./configure --enable-server --with-postgresql --with-libcurl --with-jabber --with-net-snmp --enable-ipv6 --with-openipmi --with-ssh2 –-with-ldap –-enable-agent
Note
The zabbix_get and zabbix_send command lines are generated only if --enable-agent is specified during server compilation.
If the configuration is complete without errors, we should see something like this:
  Enable server:         yes
  Server details:
    With database:         PostgreSQL
    WEB Monitoring via:    cURL
    Native Jabber:         yes
    SNMP:                  net-snmp
    IPMI:                  openipmi
    SSH:                   yes
    ODBC:                  no
    Linker flags:          -rdynamic       -L/usr/lib64     -L/usr/lib64  -L/usr/lib64 -L/usr/lib -L/usr/lib -L/usr/lib
    Libraries:             -lm -lrt  -lresolv      -lpq  -liksemel  -lcurl  -lnetsnmp -lcrypto  -lnetsnmp -lcrypto -lssh2 -lOpenIPMI -lOpenIPMIposix -lldap -llber

  Enable proxy:          no

  Enable agent:          yes
  Agent details:
    Linker flags:          -rdynamic     -L/usr/lib
    Libraries:             -lm -lrt  -lresolv    -lcurl -lldap -llber

  Enable Java gateway:   no

  LDAP support:          yes
  IPv6 support:          yes
***********************************************************
*            Now run 'make install'                       *
*                                                         *
*            Thank you for using Zabbix!                  *
*              <http://www.zabbix.com>                    *
***********************************************************
We will not run make install but only the compilation with # make. To specify a different location for the Zabbix server, we need to use a --prefix on the configure options, for example, --prefix=/opt/zabbix. Now, follow the instructions as explained in the Installing and creating the package section.
To configure the sources to create the agent, we need to run the following command:
# ./configure --enable-agent
# make
In both the previous sections, the command line ends right before the installation, indeed we didn't run the following command:
# make install
I advise you to not run the make install command but use the checkinstall software instead. This software will create the package and install the Zabbix software.
You can download the software from http://asic-linux.com.mx/~izto/checkinstall/.
Note that checkinstall is only one of the possible alternatives you have to create a distributable system package.
Note
We can also use a prebuild checkinstall. The current release is checkinstall-1.6.2-20.2.i686.rpm (on Red Hat/CentOS); the package will also need rpm-build:
yum install rpm-build
And we need to create the necessary directories:
mkdir -p ~/rpmbuild/{BUILD,RPMS,SOURCES,SPECS,SRPMS}The package made things easy; it is easy to distribute and upgrade the software plus we can create a package for different versions of a package manager: RPM, deb, and tgz.
Tip
checkinstall can produce a package for Debian, Slackware, and RedHat. This is particularly useful to produce the Zabbix's agent package (statically linked) and to distribute it around our server.
Now we need to convert to root or use the sudo checkinstall command followed by its options:
# checkinstall --nodoc --install=yes -y
If you don't face any issue, you should get the following message:
******************************************************************
 Done. The new package has been saved to

 /root/rpmbuild/RPMS/i386/zabbix-2.0.6-1.i386.rpm
 You can install it in your system anytime using:

      rpm -i zabbix-2.0.6-1.i386.rpm
******************************************************************
Now Zabbix is installed. The server binaries will be installed into <prefix>/sbin, utilities will be on <prefix>/bin, and the man pages under the <prefix>/share location.
For the server configuration, we only have one file to check and edit:
/usr/local/etc/zabbix_server.conf
The configuration files are inside the following directory:
/usr/local/etc
We need to change the /usr/local/etc/zabbix_server.conf file and write the username, relative password, and the database name there.
Note
This location depends on the sysconfdir compile-time installation variable. Don't forget to take appropriate measures to protect the access to the configuration file with the following command:
chmod 400/usr/local/etc/zabbix_server.conf
The location of the default external scripts will be:
/usr/local/share/zabbix/externalscripts
It depends on the datadir compile-time installation variable. The alertscripts directory will be at the following location:
/usr/local/share/zabbix/alertscripts
Now we need to configure the agent. The configuration file is where we need to write the IP address of our Zabbix server. Once done, it is important to add two new services to the right runlevel to be sure that they will start when the server enters on the right runlevel.
To complete this task we need to install the start/stop scripts on the following:
/
etc/init.d/zabbix-agent/etc/init.d/zabbix-proxy/etc/init.d/zabbix-server
There are several scripts prebuilt inside the misc folder located at the following location:
zabbix-2.0.6/misc/init.d
This folder contains different startup scripts for different Linux variants, but this tree is not actively maintained and tested, and may not be up-to-date with the most recent versions of Linux distributions so it is better to take care and test it before going live.
Once the start/stop script is added inside the /etc/init.d folder, we need to add it to the service list:
# chkconfig --add zabbix-server
# chkconfig --add zabbix-agentd
Now all that is left is to tell the system on which runlevel it should start them, we are going to use runlevel 3 and 5.
# chkconfig --level 35 zabbix-server on
# chkconfig --level 35 zabbix-agentd on
Currently, we can't start the server; before starting up our server we need to configure the database.
Once we complete the previous step, we can walk through the database server installation. All those steps will be done on the dedicated database server. The first thing to do is install the PostgreSQL server. This can be easily done with the package offered from the distribution but is recommended to use the latest 9.x stable version.
RedHat is still distributing the 8.x on RHEL6.4. Also, its clones such as CentOS and ScientificLinux are doing the same. PosgreSQL 9.x has many useful features, at the moment, the latest stable ready for the production environment is Version 9.2.
To install the PostgreSQL 9.2, there are some easy steps to follow:
Locate the
.repofiles:Append the following line on the section(s) identified in the preceding step:
exclude=postgresql*
Browse to http://yum.postgresql.org and find your correct RPM. For example, to install PostgreSQL 9.2 on the CentOS 6 32 bit, go to http://yum.postgresql.org/9.2/redhat/rhel-6-i386/pgdg-redhat92-9.2-7.noarch.rpm.
Now to list the entire
postgresqlpackage, use the following command:# yum list postgres*
Once you find our package in the list, install it using the following command:
# yum install postgresql92 postgresql92-server postgresql92-contrib
Once the packages are installed, we need to initialize the database:
# service postgresql-9.2 initdb
Or:
# /etc/init.d/postgresql-9.2 initdb
Now we need to change a few things in the configuration file
/var/lib/pgsql/9.2/data/pg_hba.conf. We need to change the listen address, port, and also need to add a couple of lines for ourzabbix_dbdatabaselisten_addresses = '*' port = 5432 # configuration for Zabbix local zabbix_db zabbix md5 host zabbix_db zabbix <CIDR-address> md5
The
localkeyword matches all the connections made in the Unix-domain sockets. This line is followed by the database name (zabbix_db), the username (zabbix), and the authentication method (in our casemd5).The
hostkeyword matches all the connections that are coming from TCP/IP (this includes the SSL and non-SSL connections) followed by the database name (zabbix_db), the username (zabbix), the network and mask of all the hosts that are allowed, and the authentication method (in our casemd5).The network mask of the allowed hosts in our case should be a network mask because we need to allow the web interface (hosted on our web server) and the Zabbix server that is on a different dedicated server for example, 10.6.0.0/24 (a small subnet) or a large network as well. Most likely, the web interface as well the Zabbix server will be in a different network, so make sure you express all the networks and relative mask here.
Finally, we can start our PosgreSQL server using the following command:
# service postgresql-9.2 start
Or:
# /etc/init.d/postgresql-9.2 start
To create a database, we need to be a Postgres user (or the user that in your distribution is running PostgreSQL). Create a user for the database (our Zabbix user) and log in as that user to import the schema with the relative data.
The code to import the schema is as follows:
# su - postgres
-bash-4.1$
Once we become a postgres user, we can create the database (in our example, it is zabbix_db):
-bash-4.1$ psql
postgres=#  CREATE USER zabbix WITH PASSWORD '<YOUR-ZABBIX-PASSWORD-HERE>';
CREATE ROLE
postgres=# CREATE DATABASE zabbix_db WITH OWNER zabbix ENCODING='UTF8';
CREATE DATABASE
postgres=# \q
The database creation scripts are located in the ./database/postgresql folder They should be installed exactly in this order:
# cat schema.sql |  psql -U zabbix zabbix_db
# cat images.sql |  psql -U zabbix zabbix_db
# cat data.sql |  psql -U zabbix zabbix_db
Now, finally, it is the time to start our Zabbix server and test the whole setup for our Zabbix server/database.
# /etc/init.d/zabbix-server start
Starting Zabbix server:                                   [  OK  ]
A quick check on the logfile can give us more information about what is currently happening in our server. We should be able to get the following lines from the logfile (the default location is /tmp/zabbix_server.log):
 28742:20130609:133955.418 Starting Zabbix Server. Zabbix 2.0.6 (revision 35158).
 28742:20130609:133955.418 ****** Enabled features ******
 28742:20130609:133955.418 SNMP monitoring:           YES
 28742:20130609:133955.418 IPMI monitoring:           YES
 28742:20130609:133955.418 WEB monitoring:            YES
 28742:20130609:133955.418 Jabber notifications:      YES
 28742:20130609:133955.418 Ez Texting notifications:  YES
 28742:20130609:133955.418 ODBC:                       NO
 28742:20130609:133955.418 SSH2 support:              YES
 28742:20130609:133955.418 IPv6 support:              YES
 28742:20130609:133955.418 ******************************
The preceding lines tell us that our server is up and running. If the logfiles continue with the following lines, it means that is all fine: the configuration, the connection to database, and so on:
28745:20130609:133955.469 server #2 started [db watchdog #1]
 28744:20130609:133955.471 server #1 started [configuration syncer #1]
 28754:20130609:133955.494 server #9 started [trapper #1]
 28755:20130609:133955.496 server #10 started [trapper #2]
 28756:20130609:133955.498 server #11 started [trapper #3]
 28757:20130609:133955.499 server #12 started [trapper #4]
 28758:20130609:133955.501 server #13 started [trapper #5]
 28763:20130609:133955.519 server #15 started [alerter #1]
 28762:20130609:133955.526 server #14 started [icmp pinger #1]
 28765:20130609:133955.566 server #17 started [timer #1]
 28764:20130609:133955.574 server #16 started [housekeeper #1]
 28764:20130609:133955.575 executing housekeeper
Another thing to check is whether our server is running with our user:
# ps -ef |grep zabbix_server
502 28742 1  0 13:39 ?    00:00:00 /usr/local/sbin/zabbix_server
502 28744 28742 0 13:39 ? 00:00:00 /usr/local/sbin/zabbix_server
502 28745 28742 0 13:39 ? 00:00:00 /usr/local/sbin/zabbix_server
...
The preceding lines show that zabbix_server is running with the user 502. We will go ahead and verify if 502 is the user we previously created:
# getent passwd 502
zabbixsvr:x:502:501::/home/zabbixsvr:/bin/bash
The preceding lines show that is all fine. The most common issue normally is the following error:
28487:20130609:133341.529 Database is down. Reconnecting in 10 seconds.
We can have different actors that are causing this issue:
Firewall (local on our servers or infrastructure firewall)
The Postgres configuration
Wrong data on
zabbix_server.confTip
We can try to isolate the problem by running the following command on the database server:
serverpsql -h 127.0.0.1 -U zabbix zabbix_dbPassword for user zabbix:psql (9.2.4)Type "help" for help
If we have a connection, we can try the same command from the Zabbix server; if it fails, it is better to check the firewall configuration. If we get the fatal identification-authentication failed error, it is better to check the
pg_hba.conffile.
Now it is time to check how to start and stop your Zabbix installation. The scripts that follow are a bit customized to manage the different users for the server and the agent.
Note
The following startup script works fine with the standard compilation without using a --prefix and the zabbixsvr user. If you are running on a different setup, make sure you customize the executable location and the user:
exec=/usr/local/sbin/zabbix_serverzabbixsrv=zabbixsvr
For zabbix-server, create the zabbix-server file at /etc/init.d with the following content:
#!/bin/sh
#
# chkconfig: - 85 15
# description: Zabbix server daemon
# config: /usr/local/etc/zabbix_server.conf
#

### BEGIN INIT INFO
# Provides: zabbix
# Required-Start: $local_fs $network
# Required-Stop: $local_fs $network
# Default-Start:
# Default-Stop: 0 1 2 3 4 5 6
# Short-Description: Start and stop Zabbix server
# Description: Zabbix server
### END INIT INFO

# Source function library.
. /etc/rc.d/init.d/functions

exec=/usr/local/sbin/zabbix_server
prog=${exec##*/}
lockfile=/var/lock/subsys/zabbix
syscf=zabbix-server
The next parameter zabbixsvr is specified inside the start() function and it determines which user will be used to run our Zabbix server:
zabbixsrv=zabbixsvr
[ -e /etc/sysconfig/$syscf ] && . /etc/sysconfig/$syscf

start()
{
    echo -n $"Starting Zabbix server: "
In the preceding code, the user (who will own our Zabbix's server process) is specified inside the start function.
daemon --user $zabbixsrv $exec
Remember to change the ownership of the server logfile and configuration file of Zabbix, this to prevent a normal user to access sensitive data that can be acquired with Zabbix. Logfile is specified as follows:
/usr/local/etc/zabbix_server.conf
On 'LogFile''LogFile' properties    rv=$?
    echo
    [ $rv -eq 0 ] && touch $lockfile
    return $rv
}

stop()
{
    echo -n $"Shutting down Zabbix server: "
Here, inside the
stop function, we don't need to specify the user as the start/stop script runs from root so we can simply use killproc $prog as follows:
    killproc $prog
    rv=$?
    echo
    [ $rv -eq 0 ] && rm -f $lockfile
    return $rv
}

restart()
{
    stop
    start
}

case "$1" in
    start|stop|restart)
        $1
        ;;
    force-reload)
        restart
        ;;
    status)
        status $prog
        ;;
    try-restart|condrestart)
        if status $prog >/dev/null ; then
            restart
        fi
        ;;
    reload)
        action $"Service ${0##*/} does not support the reload action: " /bin/false
        exit 3
        ;;
    *)
        echo $"Usage: $0 {start|stop|status|restart|try-restart|force-
        reload}"
        exit 2
        ;;
esac
Note
The following startup script works fine with the standard compilation without using a --prefix and the zabbix_usr user. If you are running on a different setup, make sure you customize the executable location and the user:
exec=/usr/local/sbin/zabbix_agentdzabbix_usr=zabbix
For zabbix_agent, create the following zabbix-agent file at /etc/init.d/zabbix-agent:
#!/bin/sh
#
# chkconfig: - 86 14
# description: Zabbix agent daemon
# processname: zabbix_agentd
# config: /usr/local/etc/zabbix_agentd.conf
#

### BEGIN INIT INFO
# Provides: zabbix-agent
# Required-Start: $local_fs $network
# Required-Stop: $local_fs $network
# Should-Start: zabbix zabbix-proxy
# Should-Stop: zabbix zabbix-proxy
# Default-Start:
# Default-Stop: 0 1 2 3 4 5 6
# Short-Description: Start and stop Zabbix agent
# Description: Zabbix agent
### END INIT INFO

# Source function library.
. /etc/rc.d/init.d/functions

exec=/usr/local/sbin/zabbix_agentd
prog=${exec##*/}
syscf=zabbix-agent
lockfile=/var/lock/subsys/zabbix-agent
The following zabbix_usr parameter specifies the account that will be used to run Zabbix's agent:
zabbix_usr=zabbix
[ -e /etc/sysconfig/$syscf ] && . /etc/sysconfig/$syscf

start()
{
    echo -n $"Starting Zabbix agent: "
The next command uses the value of the zabbix_usr variable and permits us to have two different users, one for server and one for agent, preventing the Zabbix agent from accessing the zabbix_server.conf file that contains our database password.
    daemon --user $zabbix_usr $exec
    rv=$?
    echo
    [ $rv -eq 0 ] && touch $lockfile
    return $rv
}

stop()
{
    echo -n $"Shutting down Zabbix agent: "
    killproc $prog
    rv=$?
    echo
    [ $rv -eq 0 ] && rm -f $lockfile
    return $rv
}

restart()
{
    stop
    start
}

case "$1" in
    start|stop|restart)
        $1
        ;;
    force-reload)
        restart
        ;;
    status)
        status $prog
        ;;
    try-restart|condrestart)
        if status $prog >/dev/null ; then
            restart
        fi
        ;;
    reload)
        action $"Service ${0##*/} does not support the reload action: " /bin/false
        exit 3
        ;;
    *)
        echo $"Usage: $0 {start|stop|status|restart|try-restart|force-reload}"
        exit 2
        ;;
esac
With that setup, we have the agent that is running with zabbix_usr and the server with Unix accounts of zabbixsvr.
zabbix_usr_ 4653 1 0 15:42 ?        00:00:00 /usr/local/sbin/zabbix_agentd
zabbix_usr 4655 4653  0 15:42 ?    00:00:00 /usr/local/sbin/zabbix_agentd
zabbixsvr 4443 1  0 15:32 ?    00:00:00 /usr/local/sbin/zabbix_server
zabbixsvr 4445 4443  0 15:32 ? 00:00:00 /usr/local/sbin/zabbix_server
Zabbix uses an interesting way to keep the database the same size at all times. The database size indeed depends upon:
Number of processed values per second
Housekeeper settings
Zabbix uses two ways to store the collected data:
History
Trends
While on history, we will find all the collected data (it doesn't matter what type of data will be stored on history), trends will collect only numerical data. Its minimum, maximum, and average calculations are consolidated by hour (to keep the trend a lightweight process).
Tip
All the "strings" items such as character, log, and text do not correspond to trends since trends store only values.
There is a process called the housekeeper that is responsible to handle the retention against our database. It is strongly advised to keep the data in history as small as possible so that we do not overload the database with a huge amount of data and store the trends as long as we want.
Now since Zabbix will also be used for capacity planning purposes, we need to consider having a baseline and keeping at least a whole business period. Normally, the minimum period is one year but it is strongly advised to keep the trend history on for at least two years. These historical trends will be used during the business opening and closure to have a baseline and quantify the overhead of a specified period.
Note
If we indicate 0 as the value for trends, the server will not calculate or store trends at all. If history is set to "0", Zabbix will be able to calculate only triggers based on the last value of the item itself as it does not store historical values at all.
The most common issue that we face when aggregating data is to have values influenced by some positive spikes or fast drops in our hourly based trends, this means that huge spikes can produce a mean value per hour that is not right.
Trends in Zabbix are implemented in a smart way. The script creation for the trend table is as follows:
CREATE TABLE trends(
itemid bigin NOT NULL, clock integer DEFAULT '0'
NOT NULL, num integer DEFAULT '0'
NOT NULL, value_min numeric(16, 4) DEFAULT '0.0000'
NOT NULL, value_avg numeric(16, 4) DEFAULT '0.0000'
NOT NULL, value_max numeric(16, 4) DEFAULT '0.0000'
NOT NULL, PRIMARY KEY(itemid, clock));

CREATE TABLE trends_uint(
Itemid bigint NOT NULL, Clock integer DEFAULT '0'
NOT NULL, Num integer DEFAULT '0'
NOT NULL, value_min numeric(20) DEFAULT '0'
NOT NULL, value_avg numeric(20) DEFAULT '0'
NOT NULL, value_max numeric(20) DEFAULT '0'
NOT NULL, PRIMARY KEY(itemid, clock));
As you can see, there are two tables showing trends inside the Zabbix database:
TrendsTrends_uint
The first table, Trends, is used to store the float value. The second table, trends_uint, is used to store the unsigned integer. Both tables own the concept of keeping for each hour the:
Minimum value (
value_min)Maximum value (
value_max)Average value (
value_avg)
This feature permits us to find out and display the trends graphically using the influence of spikes and fast drop against the average value and understanding how and how much this value has been influenced. The other tables used for the historical purpose are as follows:
history: It is used to store numeric data (float)history_log: It is used to store logs (for example, the text field on PosgreSQL variable has unlimited length)history_str: It is used to store strings (up to 255 characters)history_text: It is used to store the text value (here again is a text field, so it has unlimited length)history_uint: It is used to store numeric values (unsigned integers)
Calculating the definitive database size is not an easy task because it is hard to predict how many items and the relative rate per second we will have on our infrastructure and how many events will be generated. To simplify this, we will consider the worst scenario where we have an event generated per second.
Summarizing the database size is influenced by:
Items: The number of items in particular
Refresh rate: The average refresh rate of our items
Space to store values: This value depends on RDBMS
The space used to store the data may vary from database to database, but we can simplify our work by considering some mean values to have a value that quantifies the maximum space consumed by the database. We can also consider the space used to store values on history around 50 bytes per value, the space used from a value on the trend table is normally around 128 bytes and the space used for a single event is normally around 130 bytes.
The total amount of used space can be calculated with the following formula:
Configuration + History + Trends + Events
Now, let us look into each of the components:
Configuration: This refers to the Zabbix's configuration for the server, the web interface, and all the configuration parameters that are stored into the database; this occupation is normally around 10 MB.
History: The history component is calculated using the following formula:
History retention days* (items/refresh rate)*24*3600* 50 bytes (History bytes usage average)
Trends: The trends component is calculated using the following formula:
days*(items/3600)*24*3600*128 bytes (Trend bytes usage average)
Events: The event component is calculated using the following formula:
days*events*24*3600*130 bytes (Event bytes usage average)
Now coming back to our practical example, we can consider having 5000 items refreshed every minute and we would like to have retention of 7 days the used space will be calculated as follows:
History: retention (in days) * (items/refresh rate)*24*3600* 50 bytes
50 bytes is the mean value for the space consumed by a value stored on history.
Considering 30 days the result is the following:
History will be calculated as:
30 * 5000/60 * 24*3600 *50 = 10.8GBAs we said earlier, to simplify, we will consider the worst scenario (one event per second) and will also consider keeping 5 years of events
Events will be calculated using the following formula:
retention days*events*24*3600* Event bytes usage (average)
When we calculate an event we have:
5*365*24*3600* 130 = 15.7GB
Trends will be calculated using the following formula:
retention in days*(items/3600)*24*3600*Trend bytes usage (average)
When we calculate trends we have:
5000*24*365* 128 = 5.3GB per year or 26.7GB for 5 years.
The following table shows the retention in days and the space required for the measure:
|
Type of measure |
Retention in days |
Space required |
|---|---|---|
|
History |
30 |
10.8 GB |
|
Events |
1825 (5 years) |
15.7 GB |
|
Trends |
1825 (5 years) |
26.7 GB |
|
Total |
N.A. |
53.2 GB |
The calculated size is not the initial size of our database but we need to keep in mind that this one will be our target size after 5 years. We are also considering a history of 30 days, keep in mind that this retention can be reduced in case of issues since the trends will keep and store our baseline and hourly based trends.
The history and trends retention policy can be changed easily per item. This means we can create a template with items that have a different history retention by default. Normally, the history is set to 7 days, but for some kind of measure such as in a web scenario, or other particular measure, we may need to keep all the values for more than a week. This permits us to change the value of each item.
In our example we performed a worst-case scenario with retention of 30 days, but it is good advice to keep the history only for 7 days or maybe less on large environments. If we perform a basic calculation of an item that is updated every 60 seconds and has history preserved for 7 days, it will generate:
(update interval) * (hours in a day) * (number of days in history) =60*24*7=10080
This means that for each item we will have 10,080 lines in a week and that gives us an idea of the number of lines that we will produce on our database.

Housekeeping can be quite a heavy process. As the database grows, housekeeping will require more and more time to complete its work. This issue can be sorted using the delete_history() function.
There is a way to deeply improve the housekeeping performance and fix this performance drop. The heaviest tables are: history, history_uint, trends, and trends_uint.
A solution can be the PosgreSQL table partitioning and partition of the entire tables on a monthly basis.
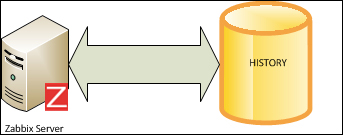
The preceding figure displays the standard and nonpartitioned history table on the database. The following figure shows how a partitioned history table will be stored in the database.
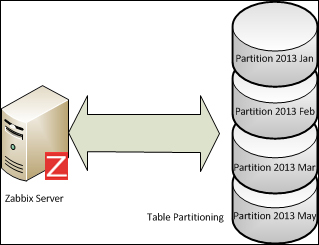
Partitioning is basically the splitting of a logical large table into smaller physical pieces. This feature can provide several benefits:
Performance of queries can be improved dramatically in situations when there is a heavy access to the table's rows in a single partition
The partitioning will reduce the index size making it more likely to fit in memory of the heavy parts that are being used
Massive deletes can be accomplished by removing partitions, instantly reducing the space allocated for the database without introducing fragmentation and heavy load on index rebuilding. The
delete partitioncommand also entirely avoids the vacuum overhead caused by a bulk deleteWhen a query updates or requires the access to a large percentage of the partition, using the sequential scan is often more efficient than the index usage with a random access or scattered reads against that index
All these benefits are worthwhile only when a table is very large. The strong point of this kind of architecture is that the RDBMS will directly access the needed partition, and the delete will simply be a delete of a partition. Partition deletion is a fast process and requires little resource.
Unfortunately, Zabbix is not able to manage the partitions so we need to disable the housekeeping and use an external process to accomplish the housekeeping.
To set up this feature, we need to create a schema where we can place all the partitioned tables:
CREATE SCHEMA partitions AUTHORIZATION zabbix;
Now we need a function that will create the partition. So to connect to Zabbix you need to run the following code:
CREATE OR REPLACE FUNCTION trg_partition()
RETURNS TRIGGER AS
$BODY$
DECLARE
    prefix text:= 'partitions.';
    timeformat text;
    selector text;
    _interval INTERVAL;
    tablename text;
    startdate text;
    enddate text;
    create_table_part text;
    create_index_part text;
BEGIN
selector = TG_ARGV[0];
IF selector = 'day'
    THEN
    timeformat:= 'YYYY_MM_DD';
ELSIF selector = 'month'
    THEN
    timeformat:= 'YYYY_MM';
END IF;

_interval:= '1 ' || selector;
tablename := TG_TABLE_NAME || '_p' || TO_CHAR(TO_TIMESTAMP(NEW.clock), timeformat);

EXECUTE 'INSERT INTO ' || prefix || quote_ident(tablename) || ' SELECT ($1).*'
USING NEW;
RETURN NULL;

EXCEPTION
    WHEN undefined_table THEN

startdate := EXTRACT(epoch FROM date_trunc(selector, TO_TIMESTAMP(NEW.clock)));
enddate := EXTRACT(epoch FROM date_trunc(selector, TO_TIMESTAMP(NEW.clock) + _interval));

create_table_part := 'CREATE TABLE IF NOT EXISTS ' || prefix || quote_ident(tablename) || ' (CHECK ((clock >= ' || quote_literal(startdate) || ' AND clock < ' || quote_literal(enddate) || '))) INHERITS (' || TG_TABLE_NAME || ')';
create_index_part := 'CREATE INDEX ' || quote_ident(tablename) || '_1 on ' || prefix || quote_ident(tablename) || '(itemid,clock)';

EXECUTE create_table_part;
EXECUTE create_index_part;

--insert it again
EXECUTE 'INSERT INTO ' || prefix || quote_ident(tablename) || ' SELECT ($1).*'
USING NEW;
RETURN NULL;

END;
$BODY$
LANGUAGE plpgsql VOLATILE
COST 100;
ALTER FUNCTION trg_partition()
OWNER TO zabbix;
Now we need a trigger connected to each table that we want to separate. This trigger will run an INSERT statement and if the partition is not ready or yet created, the function will create the partition right before the INSERT statement.
CREATE TRIGGER partition_trg BEFORE INSERT ON historyFOR EACH ROW EXECUTE PROCEDURE trg_partition('day');
CREATE TRIGGER partition_trg BEFORE INSERT ON history_syncFOR EACH ROW EXECUTE PROCEDURE trg_partition('day');
CREATE TRIGGER partition_trg BEFORE INSERT ON history_uintFOR EACH ROW EXECUTE PROCEDURE trg_partition('day');
CREATE TRIGGER partition_trg BEFORE INSERT ON history_str_syncFOR EACH ROW EXECUTE PROCEDURE trg_partition('day');
CREATE TRIGGER partition_trg BEFORE INSERT ON history_logFOR EACH ROW EXECUTE PROCEDURE trg_partition('day');
CREATE TRIGGER partition_trg BEFORE INSERT ON trendsFOR EACH ROW EXECUTE PROCEDURE trg_partition('month');
CREATE TRIGGER partition_trg BEFORE INSERT ON trends_uintFOR EACH ROW EXECUTE PROCEDURE trg_partition('month');
At this point, we miss only the housekeeping function that will replace the one built in Zabbix and disable Zabbix's native one.
The function that will handle housekeeping for us is as follows:
CREATE OR REPLACE FUNCTION delete_partitions(intervaltodelete INTERVAL, tabletype text)
  RETURNS text AS
$BODY$
DECLARE
result RECORD ;
prefix text := 'partitions.';
table_timestamp TIMESTAMP;
delete_before_date DATE;
tablename text;
BEGIN
    FOR result IN SELECT * FROM pg_tables WHERE schemaname = 'partitions' LOOP
        table_timestamp := TO_TIMESTAMP(substring(result.tablename FROM '[0-9_]*$'), 'YYYY_MM_DD');
        delete_before_date := date_trunc('day', NOW() - intervalToDelete);
        tablename := result.tablename;
        IF tabletype != 'month' AND tabletype != 'day' THEN
      RAISE EXCEPTION 'Please specify "month" or "day" instead of %', tabletype;
        END IF;
     --Check whether the table name has a day (YYYY_MM_DD) or month (YYYY_MM) format
        IF LENGTH(substring(result.tablename FROM '[0-9_]*$')) = 10 AND tabletype = 'month' THEN
            --This is a daily partition YYYY_MM_DD
            -- RAISE NOTICE 'Skipping table % when trying to delete "%" partitions (%)', result.tablename, tabletype, length(substring(result.tablename from '[0-9_]*$'));
            CONTINUE;
        ELSIF LENGTH(substring(result.tablename FROM '[0-9_]*$')) = 7 AND tabletype = 'day' THEN
            --this is a monthly partition
            --RAISE NOTICE 'Skipping table % when trying to delete "%" partitions (%)', result.tablename, tabletype, length(substring(result.tablename from '[0-9_]*$'));
            CONTINUE;
        ELSE
            --This is the correct table type. Go ahead and check if it needs to be deleted
      --RAISE NOTICE 'Checking table %', result.tablename;
        END IF;
  IF table_timestamp <= delete_before_date THEN
         RAISE NOTICE 'Deleting table %', quote_ident(tablename);
         EXECUTE 'DROP TABLE ' || prefix || quote_ident(tablename) || ';';
  END IF;
    END LOOP;
RETURN 'OK';
 END;
 $BODY$
  LANGUAGE plpgsql VOLATILE
  COST 100;
ALTER FUNCTION delete_partitions(INTERVAL, text)
  OWNER TO zabbix;
Now you have the housekeeping ready to run. To enable housekeeping, we can use the crontab by adding the following entries:
@daily psql -q -U zabbix -c "SELECT delete_partitions('7 days', 'day')"@daily psql -q -U zabbix -c "SELECT delete_partitions('24 months', 'month')"Those two tasks should be scheduled on the database server's crontab. In this example we are keeping the history of 7 days and trends of 24 months.
Now we can finally disable the Zabbix housekeeping, using the following code:
### Option: DisableHousekeeping
# If set to 1, disables housekeeping.
#
# Mandatory: no
# Range: 0-1
DisableHousekeeping=1
Restart Zabbix, now the built-in housekeeping is disabled and you should see a lot of improvement in the performance. To keep your database as lightweight as possible, you can clean up the following tables:
acknowledgesalertsauditlogeventsservice_alarms
Once you chose your own retention, you need to add a retention policy, for example, in our case it will be 2 years of retention. With the following crontab entries, you can delete all the records older than 63072000 (2 years expressed in seconds):
@daily psql -q -U zabbix -c "delete from acknowledges where clock < (SELECT (EXTRACT( epoch FROM now() ) - 63072000))"
@daily psql -q -U zabbix -c "delete from alerts where clock < (SELECT (EXTRACT( epoch FROM now() ) - 63072000))"
@daily psql -q -U zabbix -c "delete from auditlog where clock < (SELECT (EXTRACT( epoch FROM now() ) - 62208000))"
@daily psql -q -U zabbix -c "delete from events where clock < (SELECT (EXTRACT( epoch FROM now() ) - 62208000))"
@daily psql -q -U zabbix -c "delete from service_alarms where clock < (SELECT (EXTRACT( epoch FROM now() ) - 62208000))"
To disable housekeeping, we need to drop the triggers created:
DROP TRIGGER partition_trg ON history;
DROP TRIGGER partition_trg ON history_sync;
DROP TRIGGER partition_trg ON history_uint;
DROP TRIGGER partition_trg ON history_str_sync;
DROP TRIGGER partition_trg ON history_log;
DROP TRIGGER partition_trg ON trends;
DROP TRIGGER partition_trg ON trends_uint;
All those changes need to be tested and changed/modified as they fit your setup. Also be careful and back up your database.
The web interface installation is quite easy there are some basic steps to execute. The web interface is completely written on PHP so we need a web server that supports PHP, in our case, we will use Apache with the PHP support enabled.
The entire web interface is contained inside the php folder at frontends/php/ that we need to copy on our htdocs folder:
/var/www/html
Use the following commands to copy the folders:
# mkdir <htdocs>/zabbix
# cd frontends/php
# cp -a . <htdocs>/zabbix
Note
Be careful, you might need proper rights and permissions as all those files are owned by Apache and they also depend on your httpd configuration.
Now, from your web browser you need to open the following URL:
http://<server_ip_or_name>/zabbix
The first screen that you will meet is a welcome page; there is nothing to do there other than to click on Next. When on the first page, you may get a warning on your browser that informs you that the date/timezone is not set. This is a parameter inside the php.ini file. All the possible timezones are described on the official PHP website:
http://www.php.net/manual/en/timezones.php
The parameter to change is the date/timezone inside the php.ini file. If you don't know the current PHP configuration or where it is located in your php.ini file, and you need some detailed information about which modules are running or the current settings then you can write a file, for example, php-info.php inside the Zabbix directory with the following content:
<?phpphpinfo();phpinfo(INFO_MODULES);
?>
Now point your browser to:
http://your-zabbix-web-frontend/zabbix/php-info.php
You will have your full configuration printed out in a webpage. The next screenshot is more important, it displays a prerequisites check and as you can see there are three prerequisites that are not met:
Tip
Downloading the example code
You can download the example code files for all Packt books you have purchased from your account at http://www.packtpub.com . If you purchased this book elsewhere, you can visit http://www.packtpub.com/support and register to have the files e-mailed directly to you.

On standard Red-Hat/CentOS, it is easy to find the prerequisites that are not fulfilled:
PHP option post_max_size           8M    16M    Fail
PHP option max_execution_time      30    300    Fail
PHP option max_input_time          60    300    Fail
PHP bcmath                         no           Fail
PHP mbstring                       no           Fail
PHP gd  unknown                          2.0    Fail
PHP gd PNG support                 no           Fail
PHP gd JPEG support                no           Fail
PHP gd FreeType support            no           Fail
PHP xmlwriter                      no           Fail
PHP xmlreader                      no           Fail
Most of these parameters are contained inside the php.ini file. To fix them, I have changed the following options inside the /etc/php.ini file:
[Date]
; Defines the default timezone used by the date functions
; http://www.php.net/manual/en/datetime.configuration.php#ini.date.timezone
date.timezone = Europe/Rome

; Maximum size of POST data that PHP will accept.
; http://www.php.net/manual/en/ini.core.php#ini.post-max-size
post_max_size = 16M

; Maximum execution time of each script, in seconds
; http://www.php.net/manual/en/info.configuration.php#ini.max-execution-time
max_execution_time = 300

; Maximum amount of time each script may spend parsing request data. It's a good
; idea to limit this time on productions servers in order to eliminate unexpectedly
; long running scripts.
; Default Value: -1 (Unlimited)
; Development Value: 60 (60 seconds)
; Production Value: 60 (60 seconds)
; http://www.php.net/manual/en/info.configuration.php#ini.max-input-time
max_input_time = 300
To solve the missing library, we need to install the following packages:
php-xmlphp-bcmathphp-mbstringphp-gd
We will use the following command to install these packages:
# yum install php-xml php-bcmath php-mbstring php-gd
The whole list or the prerequisite list is given in the following table:
|
Prerequisite |
Min value |
Solution |
|---|---|---|
|
PHP Version |
5.1.6 | |
|
PHP |
128M |
In |
|
PHP |
16M |
In |
|
PHP |
2M |
In |
|
PHP |
300 Seconds |
In |
|
PHP |
300 seconds |
In |
|
PHP |
Disabled |
In |
|
|
Use | |
|
|
Use | |
|
|
This extension is required for the user script support php-net-socket module | |
|
|
PHP GD extension must support PNG images | |
|
|
Use | |
|
|
Use | |
|
|
Use | |
|
|
Use | |
|
|
Use | |
|
|
Use |
Every time you change a php.ini file or install a PHP extension the httpd needs a restart to get the change. Once all the prerequisites are met, we can click on Next and go ahead. On the next screen, we need to configure the database connection. We simply need to fill the form with the username, password, IP address, or hostname and also need to specify the kind of database server we are using.

If the connection is fine (can be checked with a test connection), we can proceed to the next step.

There is no check for connection available on this page so it is better to verify that it is possible to reach the Zabbix server from the network. In this form, it is necessary to fill the Host (or IP address) of our Zabbix server. Since we are installing the infrastructure on three different servers, we need to specify all the parameters and check that the Zabbix server port is available on the outside of the server.
Once we fill this form, we can click on Next. After this, the installation wizard proposes that we to view Pre-Installation summary, which is a complete summary of all the configuration parameters. If all is fine just click on Next, otherwise we can go back and change our parameters. When we go ahead, we see the configuration file has been generated (for example, in this installation in //usr/share/zabbix/conf/zabbix.conf.php).
It can happen that you may get an error instead of a success notification, and most probably, it is about the directory permission on our conf directory at /usr/share/zabbix/conf. Remember to make the directory writable to the httpd user (normally Apache is writable) at least for the time needed to create this file. Once this step is completed, the frontend is ready and we can perform our first login.
Quite often people mix up the difference between capacity planning and performance tuning. Well the scope of performance tuning is to optimize the system you already have in place for better performance. Using your current performance acquired as a baseline, capacity planning determines what your system needs and when it is needed. Here, we will see how to organize our monitoring infrastructure to achieve this goal and provide us a useful baseline. Unfortunately, this chapter cannot cover all the aspects of this argument, we should have one whole book about capacity planning, but after this section, we will look at our Zabbix with a different vision and will be aware of what to do with it.
Zabbix is a good monitoring system because it is really lightweight. Unfortunately, every observed system will spend a bit of its resources to run the agent that acquires and measures data and metrics against the operating system so it is normal if the agent introduces a small (normally very small) overhead on the guest system. This is known as the observer effect. We can only accept this burden on our server and be aware that this will introduce a slight distortion in data collection, bearing in mind to keep it lightweight to a feasible extent while monitoring the process and our custom checks.
The Zabbix agent's job is to collect data periodically from the monitored machine and send metrics to the Zabbix server (that will be our aggregation and elaboration server). Now, in this scenario there are some important things to consider:
What we are going to acquire?
How we are going to acquire these metrics (the way or method used)?
The frequency with which this measurement is performed
Considering the first point, it is important to think what should be monitored on our host and the kind of work that our host will do, or in other words what it will serve.
There are some basic metrics of operating systems that are nowadays more or less standardized, and those are: the CPU workload, percentage of free memory, memory usage details, usage of swap, CPU time for some process, and all this family of measure, all of them are built-in on the Zabbix agent.
Having a set of items with built-in measurement means that those are optimized to produce less workload possible on the monitored host, the whole of Zabbix's agent code is written in this way.
All the others metrics can be divided by service that our server should provide.
Note
Here templates are really useful! (Also, it is an efficient way to aggregate our metrics by type.)
Doing a practical example and considering monitoring an RDBMS it will be fundamental to acquire:
All the operating system metrics
Different custom RDBMS metrics
Our different custom RDBMS metrics can be: the number of users connected, or the usage of caches systems, the number of full table scans, and so on.
All those kind of metrics will be really useful and can be easily interpolated and compared against the same time period in a graph. Graphs have some strong points:
Useful to understand (also from the business side )
Often nice to present and integrate on slides to enforce our speech
Coming back to our practical example, well, currently we are acquiring data from our RDBMS and our operating system. (we can compare the workload of our RDBMS and see how this reflects the workload against our OS.) Well and now?
Most probably, our core business is the revenue of a website, merchant site, or some web application. We assume that we need to keep a website in a three-tier environment under control because it is a quite common case. Our infrastructure will be composed of the following actors:
A web server
An application server
RDBMS
In real life, most probably this is the kind of environment Zabbix will be configured on. We need to be aware that every piece and every component that can influence our service should be measured and stored inside our Zabbix monitoring system. Generally we can consider it to be quite normal to see people with a strong system administration background to be more focused on operating system-related items as well. We also saw people writing Java code that needs to be concentrated on some other obscure measure such as the number of threads. The same kind of reasoning can be done if the capacity planner talks with a database administrator, or the specific guy of every sector.
This is a quite important point because the Zabbix implementer should have a global vision and should remember that when buying a new hardware the interface will most likely be a business unit.
This business unit very often doesn't know anything about the number of threads that our system can support, but will only understand customer satisfaction, customer-related issues, or how many concurrent users we can successfully serve.
Having said that, it is really important to be ready to talk in their language, and we can do that only if we have some efficient items to graph.
Now if we look at the whole infrastructure from a client's point of view, we can think that if all our pages are served in a reasonable time the browsing experience will be pleasant.
Our goal in this case is to make our clients happy and the whole infrastructure reliable. Now we need to have two kinds of measures:
The one felt from the user side (response time of our web pages)
Infrastructure items related with it
We need to quantify the response time related to the user's navigation feeling, we need to know how much an user can wait in front of a web page to get a response, keeping in mind that the whole browsing experience needs to be pleasant. We can measure and categorize our metric with these three levels of response time:
0.2 seconds: It gives the feel of an instantaneous response. The user feels the browser reaction was caused by him/her and not from a server with a business logic.
1-2 seconds: The users feel the browsing is continuous without any interruption. The user can move freely rather than waiting for the pages to load.
10 seconds: The liking for our website will drop. The user will want a better performance and can definitely be distracted by other things.
Now we have our thresholds and we can measure the response of a web page during normal browsing, in the meantime we can set some trigger level to warn us when the response time is more than two seconds for a page.
Now we need to relate that with all our other measures: the number of users connected, the number of sessions in our application server, and the number of connections to our database and relate all our measures with the response time and the number of users connected. Now we need to measure how our system is serving pages to users during normal browsing.
This can be defined as a baseline. It is where we currently are and is a measure of how our system is performing under a normal load.
Now that we know how we are, and we have defined some threshold for our goal along with the pleasant browsing experience let's move forward.
We need to know which one is our limit, and more importantly how the system should reply to our requests. Since we can't hire a room full of people that can click on our website like crazy, we need to use the software to simulate this kind of behavior. There are some interesting open source software that do exactly this. There are different alternatives to choose from, one of them is Siege (http://www.joedog.org/JoeDog/Siege).
Seige permits us to simulate a stored browser history and load it on our server. We need to keep in mind that users, real users, will never be synchronized with each other. So it is important to introduce some delay between all the requests. Remember that if we have a login then we need to use a database of users because application servers cache their object and we don't want to measure how good the process is caching in them. The basic rule is to create a real browsing scenario against our website, so users who login can logout with just a click and without any random delay.
The stored scenarios should be repeated x times with a growing number of users, meaning our Zabbix will store our metrics, and at a certain point we will pass our first threshold (1-2 seconds per web page). We can go ahead until the response time reaches the value of our second threshold. There is no way to see how much load our server can take but it is well known that appetite comes with eating, so I will not be surprised if you go ahead and load your server until it crashes one of the components of your infrastructure.
Drawing graphs that relate the response time with the number of users' server will help us see whether our three-tier web architecture is linear or not. Most probably it will grow in a linear pattern until a certain point. This segment is the one on which our system is performing fine. We can also see the components inside Zabbix and from this point we can introduce some kind of delay and draw some considerations.
Now we know exactly what to expect from our system and how the system can serve our users. We can see which component is the first that suffers the load, and where we need to plan a tuning.
Capacity planning can be done without digging and going deep into what to optimize. As said earlier, there are two different tasks: performance tuning and capacity planning that are related but different. We can simply review our performance and plan our infrastructure expansion.
Tip
A planned hardware expansion is always cheaper than an unexpected, emergency hardware improvement.
We can also follow performance tuning, but be aware that there is a relation between the time spent and the performance obtained, so we need to understand when it is time to stop our performance tuning.
One of the most important features of Zabbix is the capacity to store historical data. This feature is of vital importance during the task of predicting trends. Predicting our trends is not an easy task and is important considering the business that we are serving, and when looking at historical data we should see if there are repetitive periods or if there is a sort of formula that can express our trend.
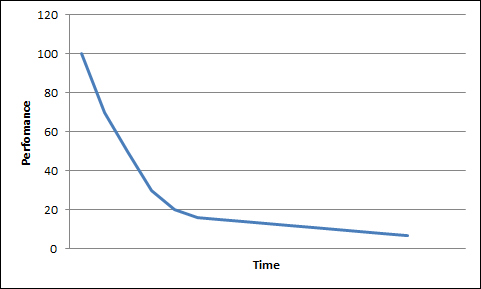
For instance, it is possible that the online web store we are monitoring needs more and more resources during a particular period of the year, for example, close to public holidays if we sell travels. Doing a practical example, you can consider the used space on a specific server disk. Zabbix gives us the export functionality to get our historical data, so it is quite easy to import them in a spreadsheet. Excel has a curve fitting option that will help us a lot. It is quite easy to find a trend line using Excel that will tell us when we are going to reach all our disk space. To add a trend line into Excel, we need to create at first a "scattered graph" with our data; here it is also important to graph the disk size. After this we can try to find a mathematical equation that is closer to our trend. There are different kinds of formula that we can choose; in this example I used a Linear equation because the graphs are growing with a linear relation.
The graph that comes out from this process permits us to know, with a considerable degree of precision, when we will run out of space.
Now it is clear how important it is to have a considerable quantity of historical data, bearing in mind the business period and how they influence data.
Tip
It is important to keep a track of the trend/regression line used and the relative formula with R-squared value so that it is possible to calculate it with precision, and if there aren't any changes in trends, when the space will be exhausted.
The graph obtained is shown in the following figure, and from this graph it is simple to see that if the trends don't change, we are going to run out of space on June 25, 2013.
