

Heat maps for graphical networks are a type of visualization to help you understand the distance of one node from other reachable nodes in the graph. Gephi allows us to generate heat maps only for directed networks—that is, only for when all the edges in the network are directed.
While starting Gephi, open the Les Misérables graph in the directed mode by selecting the Directed option from the Graph Type drop-down list on the screen that comes after you click on Les Misérables on the welcome screen. The graph will look something like the one in the following screenshot:
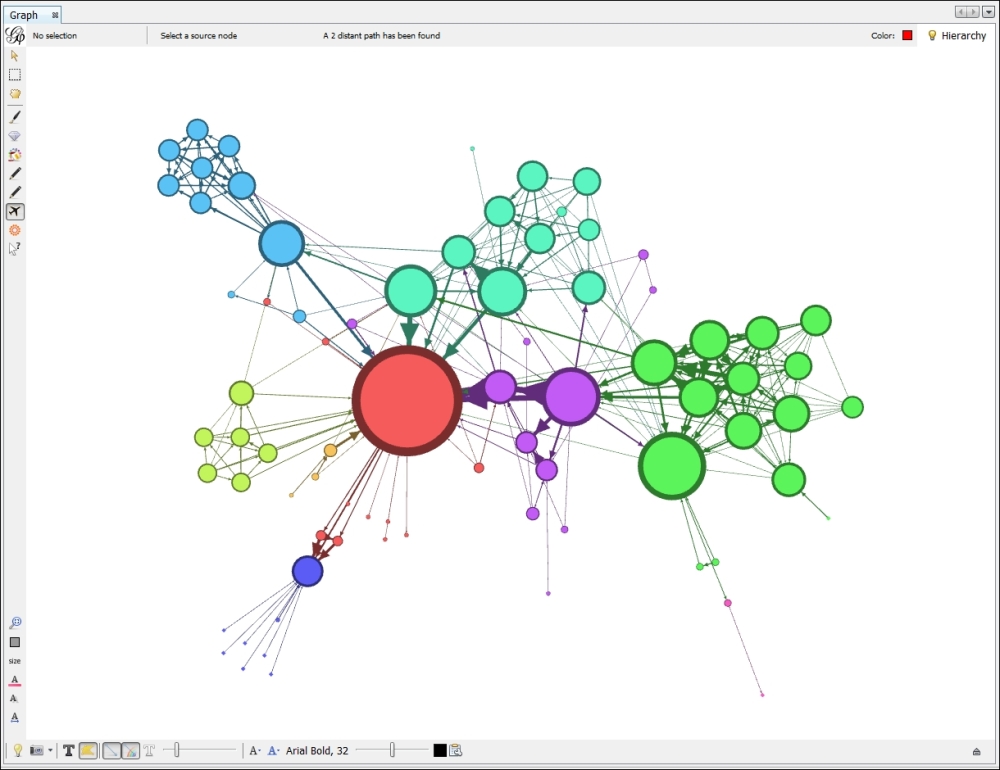
This recipe describes the procedure to generate a heat map on the network with respect to a node in the graph. To do this, perform the following steps: