Book Image

Getting Started with Microsoft System Center Operations Manager

By : Kevin Greene
Book Image

Getting Started with Microsoft System Center Operations Manager

By: Kevin Greene

Overview of this book

Most modern IT environments comprise a heterogeneous mixture of servers, network devices, virtual hypervisors, storage solutions, cross-platform operating systems and applications. All this complexity brings a requirement to deliver a centralized monitoring and reporting solution that can help IT administrators quickly identify where the problems are and how best to resolve them. Using System Center Operations Manager (OpsMgr), administrators get a full monitoring overview of the IT services they have responsibility for across the organization - along with some useful management capabilities to help them remediate any issues they've been alerted to. This book begins with an introduction to OpsMgr and its core concepts and then walks you through designing and deploying the various roles. After a chapter on exploring the consoles, you will learn how to deploy agents, work with management packs, configure network monitoring and model your IT services using distributed applications. There’s a chapter dedicated to alert tuning and another that demonstrates how to visualize your IT using dashboards. The final chapters in the book discuss how to create alert subscriptions, manage reports, backup and recover OpsMgr, perform maintenance and troubleshoot common problems.
Table of Contents (18 chapters)
Getting Started with Microsoft System Center Operations Manager
Credits
About the Author
About the Reviewers
www.PacktPub.com
Preface
Index

Exploring dashboard layouts and templates


In the Working with Views section of Chapter 3, Exploring the Consoles, we introduced the Dashboard View and walked you through creating a new dashboard using the Grid Layout with four different widgets. Here, we'll take a look at each of the other dashboard layouts and templates that you can work with in OpsMgr and we'll also show you how to unlock a hidden Datacenter Dashboard template that contains some unique options for visualizing the health and performance of your monitored objects.

In Figure 9.1, you can see a list of all the available dashboard layouts and templates that you get with a default installation of OpsMgr. These options can be accessed when you create a new dashboard view in the Monitoring workspace.

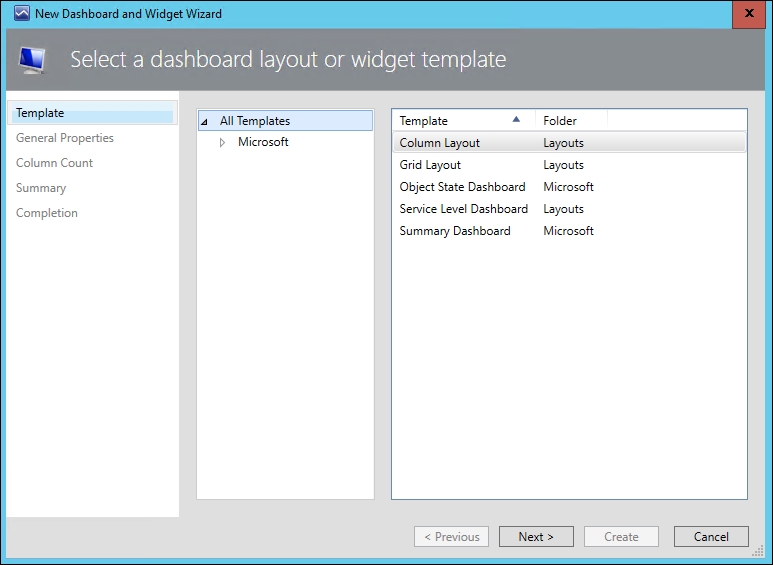
Figure 9.1: Default dashboard layouts and templates

Column Layout

When configuring this layout, you can choose up to a maximum of five empty columns/cells to add to a dashboard. Each column can be populated with a different widget type...