Book Image

Monitoring Docker

By : Russ McKendrick
Book Image

Monitoring Docker

By: Russ McKendrick

Overview of this book

This book will show you how monitoring containers and keeping a keen eye on the working of applications helps improve the overall performance of the applications that run on Docker. With the increased adoption of Docker containers, the need to monitor which containers are running, what resources they are consuming, and how these factors affect the overall performance of the system has become the need of the moment. This book covers monitoring containers using Docker's native monitoring functions, various plugins, as well as third-party tools that help in monitoring. Well start with how to obtain detailed stats for active containers, resources consumed, and container behavior. We also show you how to use these stats to improve the overall performance of the system. Next, you will learn how to use SysDig to both view your containers performance metrics in real time and record sessions to query later. By the end of this book, you will have a complete knowledge of how to implement monitoring for your containerized applications and make the most of the metrics you are collecting
Table of Contents (15 chapters)
Monitoring Docker
Credits
About the Author
About the Reviewer
www.PacktPub.com
Preface
Index

The Web interface


cAdvisor should be running on the 8080 port; if you open http://192.168.33.10:8080/, you should be greeted with the cAdvisor logo and an overview of your host machine:

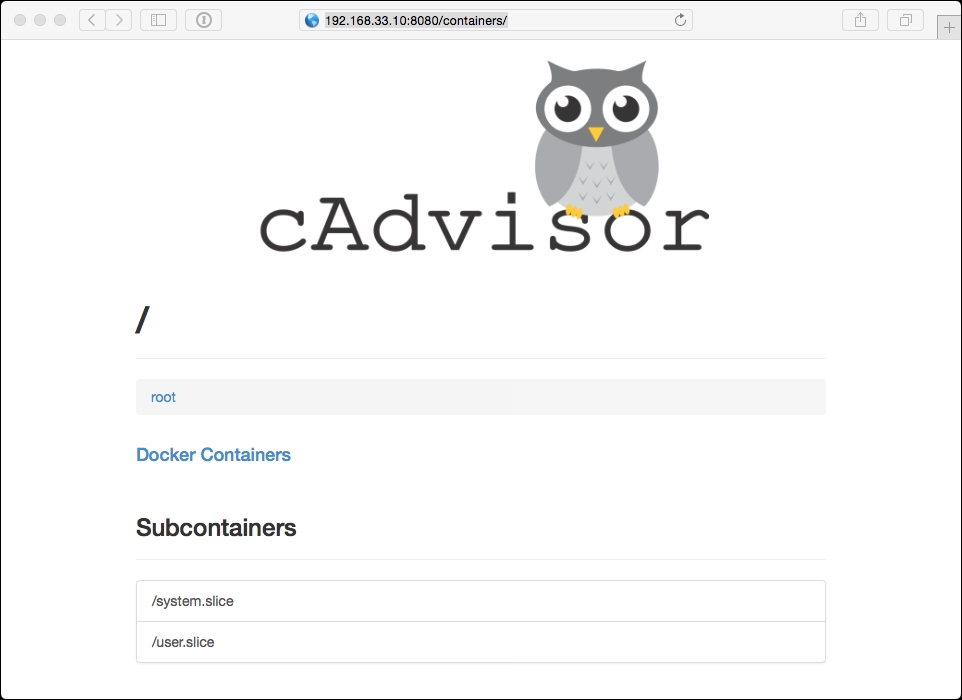
This initial page streams live stats about the host machine, though each section is repeated when you start to drill down and view the containers. To start with, let's look at each section using the host information.

Overview

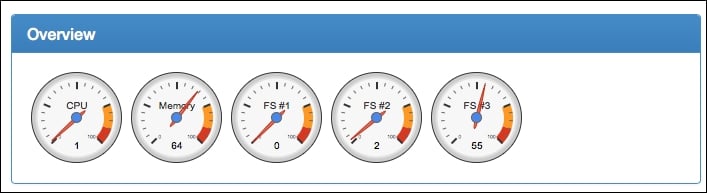
This overview section gives you a bird's-eye view of your system; it uses gauges so you can quickly get an idea of which resources are reaching their limits. In the following screenshot, there is very little in the way of CPU utilization and the file system usage is relatively low; however, we are using 64% of the available RAM:

Processes

The following screenshot displays a combined view of the output of the ps aux, dockerps and top commands we used in the previous chapter:

Here is what each column heading means:

  • User: This shows which user is running the process

  • PID: This is the unique process...