Book Image

Mastering Wireshark 2

By : Andrew Crouthamel
Book Image

Mastering Wireshark 2

By: Andrew Crouthamel

Overview of this book

Wireshark, a combination of a Linux distro (Kali) and an open source security framework (Metasploit), is a popular and powerful tool. Wireshark is mainly used to analyze the bits and bytes that flow through a network. It efficiently deals with the second to the seventh layer of network protocols, and the analysis made is presented in a form that can be easily read by people. Mastering Wireshark 2 helps you gain expertise in securing your network. We start with installing and setting up Wireshark2.0, and then explore its interface in order to understand all of its functionalities. As you progress through the chapters, you will discover different ways to create, use, capture, and display filters. By halfway through the book, you will have mastered Wireshark features, analyzed different layers of the network protocol, and searched for anomalies. You’ll learn about plugins and APIs in depth. Finally, the book focuses on pocket analysis for security tasks, command-line utilities, and tools that manage trace files. By the end of the book, you'll have learned how to use Wireshark for network security analysis and configured it for troubleshooting purposes.
Table of Contents (18 chapters)
Title Page
Copyright and Credits
Packt Upsell
Contributor
Preface
Free Chapter
1
Installing Wireshark 2
Index

Graph I/O rates and TCP trends


In this section, we'll take a look at using graphs to help visualize packets and trends, especially in TCP communications. Here we have a packet capture of a file transfer that has gone horribly wrong:

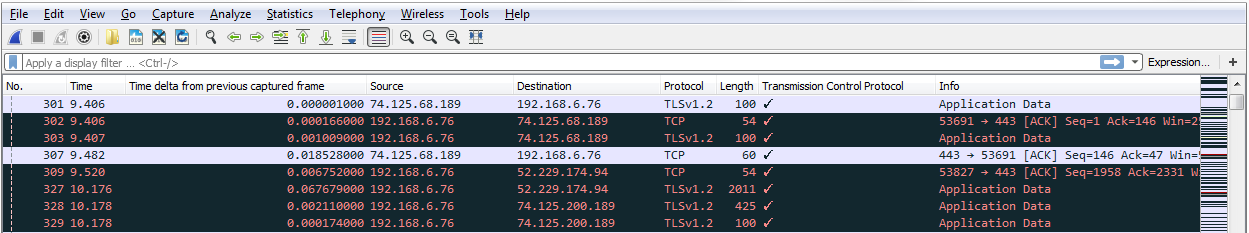
As you can see, we have all sorts of black bars coming up, which is a big telltale sign in Wireshark that there's something amiss. You can also see there's a striping pattern that comes about. That's a big telltale sign that there are a bunch of retransmissions. So, what we'll do is use this as our basis for graphing and being able to pick out some issues.

Throughput

One of the first things we'll do is go up to Statistics | TCP Stream GraphsThroughput:

When we click on Throughput, we will see that a graph comes up:

Whether it's graphing I/O rates going into the section, going for TCP stream graphs, or anywhere like that, all the graphs are unidirectional. Depending on what packet we have selected, it will show us the throughput for that or the I/O rate, or whatever...