
The critical element in scaling Pods is the Kubernetes Metrics Server. You might consider yourself a Kubernetes ninja and yet never heard of the Metrics Server. Don't be ashamed if that's the case. You're not the only one.
If you started observing Kubernetes metrics, you might have used Heapster. It's been around for a long time, and you likely have it running in your cluster, even if you don't know what it is. Both serve the same purpose, with one being deprecated for a while, so let's clarify things a bit.
Early on, Kubernetes introduced Heapster as a tool that enables Container Cluster Monitoring and Performance Analysis for Kubernetes. It's been around since Kubernetes version 1.0.6. You can say that Heapster has been part of Kubernetes' life since its toddler age. It collects and interprets various metrics like resource usage, events, and so on. Heapster has been an integral part of Kubernetes and enabled it to schedule Pods appropriately. Without it, Kubernetes would be blind. It would not know which node has available memory, which Pod is using too much CPU, and so on. But, just as with most other tools that become available early, its design was a "failed experiment".
As Kubernetes continued growing, we (the community around Kubernetes) started realizing that a new, better, and, more importantly, a more extensible design is required. Hence, Metrics Server was born. Right now, even though Heapster is still in use, it is considered deprecated, even though today (September 2018) the Metrics Server is still in beta state.
So, what is Metrics Server? A simple explanation is that it collects information about used resources (memory and CPU) of nodes and Pods. It does not store metrics, so do not think that you can use it to retrieve historical values and predict tendencies. There are other tools for that, and we'll explore them later. Instead, Metrics Server's goal is to provide an API that can be used to retrieve current resource usage. We can use that API through kubectl or by sending direct requests with, let's say, curl. In other words, Metrics Server collects cluster-wide metrics and allows us to retrieve them through its API. That, by itself, is very powerful, but it is only the part of the story.
I already mentioned extensibility. We can extend Metrics Server to collect metrics from other sources. We'll get there in due time. For now, we'll explore what it provides out of the box and how it interacts with some other Kubernetes resources that will help us make our Pods scalable and more resilient.
If you read my other books, you know that I do not go into much theory and, instead, prefer demonstrating features and principles through practical examples. This book is no exception, and we'll dive straight into Metrics Server hands-on exercises. The first step is to install it.
Helm makes installation of almost any publicly available software very easy if there is a Chart available. If there isn't, you might want to consider an alternative since that is a clear indication that the vendor or the community behind it does not believe in Kubernetes. Or, maybe they do not have the skills necessary to develop a Chart. Either way, the best course of action is to run away from it and adopt an alternative. If that's not an option, develop a Helm Chart yourself. In our case, there won't be a need for such measures. Metrics Server does have a Helm Chart, and all we need to do is to install it.
Google and Microsoft already ship Metrics Server as part of their managed Kubernetes clusters (GKE and AKS). There is no need to install it, so please skip the commands that follow.
Metrics Server is available as one of the plugins. Please execute minikube addons enable metrics-server and kubectl -n kube-system rollout status deployment metrics-server commands instead of those following.
Recent updates to the Metrics Server do not work with self-signed certificates by default. Since Docker for Desktop uses such certificates, you'll need to allow insecure TLS. Please add --set args={"--kubelet-insecure-tls=true"} argument to the helm install command that follows.
 1  helm install stable/metrics-server \
 2      --name metrics-server \
 3      --version 2.0.2 \
 4      --namespace metrics
 5
 6  kubectl -n metrics \
 7      rollout status \
 8      deployment metrics-server
We used Helm to install Metrics Server, and we waited until it rolled out.
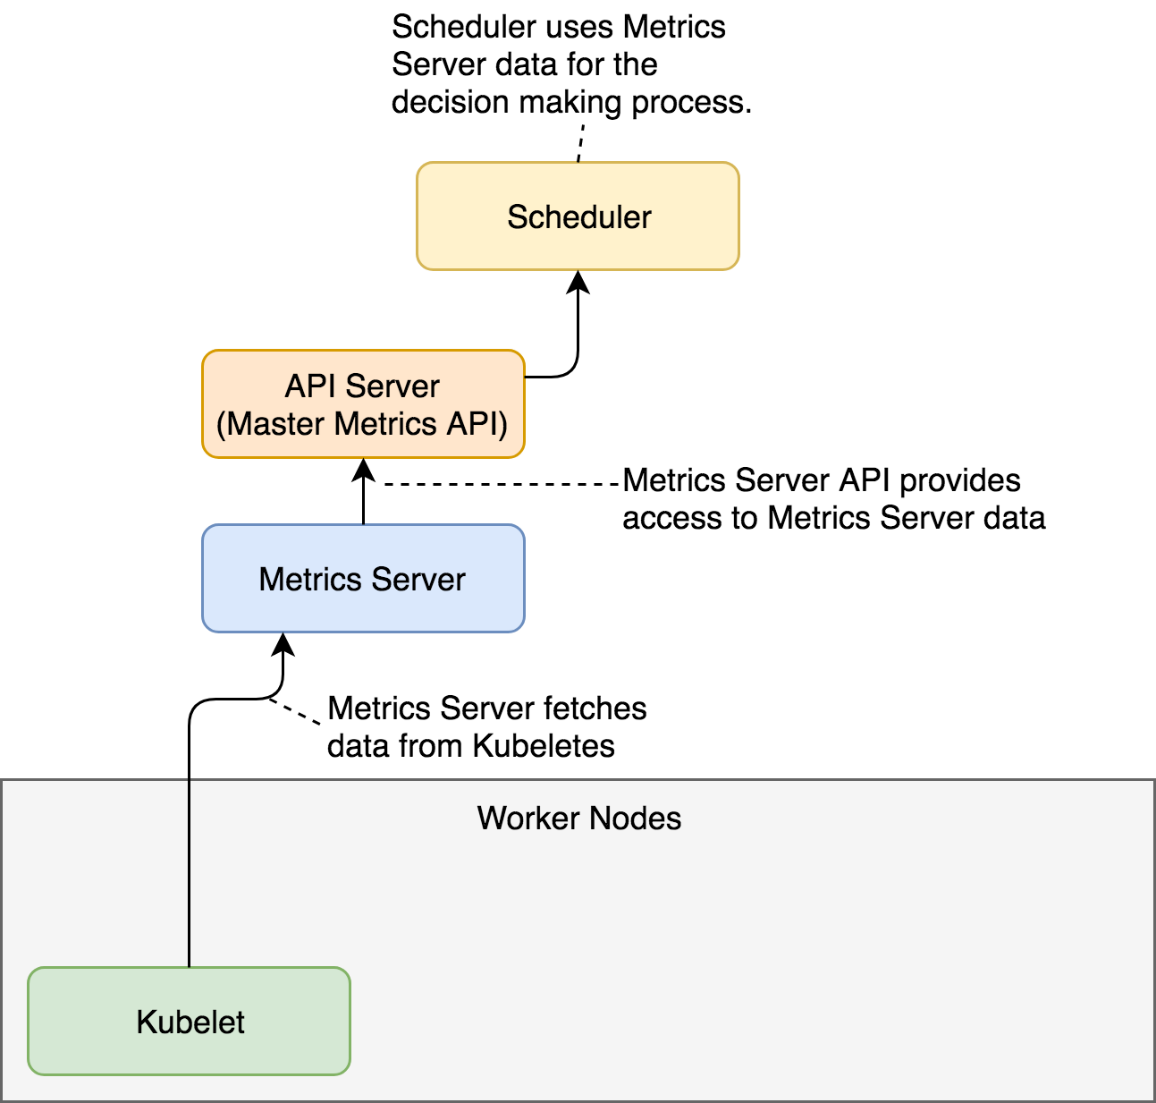
Metrics Server will periodically fetch metrics from Kubeletes running on the nodes. Those metrics, for now, contain memory and CPU utilization of the Pods and the nodes. Other entities can request data from the Metrics Server through the API Server which has the Master Metrics API. An example of those entities is the Scheduler that, once Metrics Server is installed, uses its data to make decisions.
As you will see soon, the usage of the Metrics Server goes beyond the Scheduler but, for now, the explanation should provide an image of the basic flow of data.
Now we can explore one of the ways we can retrieve the metrics. We'll start with those related to nodes.
1 kubectl top nodes
If you were fast, the output should state that metrics are not available yet. That's normal. It takes a few minutes before the first iteration of metrics retrieval is executed. The exception is GKE and AKS that already come with the Metrics Server baked in.
Fetch some coffee before we repeat the command.
1 kubectl top nodes
This time, the output is different.
My output is as follows.
NAME               CPU(cores) CPU% MEMORY(bytes) MEMORY%
docker-for-desktop 248m       12%  1208Mi        63%
We can see that I have one node called docker-for-desktop. It is using 248 CPU milliseconds. Since the node has two cores, that's 12% of the total available CPU. Similarly, 1.2 GB of RAM is used, which is 63% of the total available memory of 2 GB.
Resource usage of the nodes is useful but is not what we're looking for. In this chapter, we're focused on auto-scaling Pods. But, before we get there, we should observe how much memory each of our Pods is using. We'll start with those running in the kube-system Namespace.
1 kubectl -n kube-system top pod
The output (on Docker for Desktop) is as follows.
NAME                                       CPU(cores) MEMORY(bytes)
etcd-docker-for-desktop                    16m        74Mi
kube-apiserver-docker-for-desktop          33m        427Mi
kube-controller-manager-docker-for-desktop 44m        63Mi
kube-dns-86f4d74b45-c47nh                  1m         39Mi
kube-proxy-r56kd                           2m         22Mi
kube-scheduler-docker-for-desktop          13m        23Mi
tiller-deploy-5c688d5f9b-2pspz             0m         21Mi
We can see resource usage (CPU and memory) for each of the Pods currently running in kube-system. If we do not find better tools, we could use that information to adjust requests of those Pods to be more accurate. However, there are better ways to get that info, so we'll skip adjustments for now. Instead, let's try to get current resource usage of all the Pods, no matter the Namespace.
1 kubectl top pods --all-namespaces
The output (on Docker for Desktop) is as follows.
NAMESPACE   NAME                                       CPU(cores) MEMORY(bytes)
docker      compose-7447646cf5-wqbwz                   0m         11Mi
docker      compose-api-6fbc44c575-gwhxt               0m         14Mi
kube-system etcd-docker-for-desktop                    16m        74Mi
kube-system kube-apiserver-docker-for-desktop          33m        427Mi
kube-system kube-controller-manager-docker-for-desktop 46m        63Mi
kube-system kube-dns-86f4d74b45-c47nh                  1m         38Mi
kube-system kube-proxy-r56kd                           3m         22Mi
kube-system kube-scheduler-docker-for-desktop          14m        23Mi
kube-system tiller-deploy-5c688d5f9b-2pspz             0m         21Mi
metrics     metrics-server-5d78586d76-pbqj8            0m         10Mi
That output shows the same information as the previous one, only extended to all Namespaces. There should be no need to comment it.
Often, metrics of a Pod are not granular enough, and we need to observe the resources of each of the containers that constitute a Pod. All we need to do to get container metrics is to add --containers argument.
 1  kubectl top pods \
 2    --all-namespaces \
 3    --containers
The output (on Docker for Desktop) is as follows.
NAMESPACE   POD                                        NAME                 CPU(cores) MEMORY(bytes)
docker      compose-7447646cf5-wqbwz                   compose                 0m         11Mi
docker      compose-api-6fbc44c575-gwhxt               compose                 0m         14Mi
kube-system etcd-docker-for-desktop                    etcd                    16m        74Mi
kube-system kube-apiserver-docker-for-desktop          kube-apiserver          33m        427Mi
kube-system kube-controller-manager-docker-for-desktop kube-controller-manager 46m        63Mi
kube-system kube-dns-86f4d74b45-c47nh                  kubedns                 0m         13Mi
kube-system kube-dns-86f4d74b45-c47nh                  dnsmasq                 0m         10Mi
kube-system kube-dns-86f4d74b45-c47nh                  sidecar                 1m         14Mi
kube-system kube-proxy-r56kd                           kube-proxy              3m         22Mi
kube-system kube-scheduler-docker-for-desktop          kube-scheduler          14m        23Mi
kube-system tiller-deploy-5c688d5f9b-2pspz             tiller                  0m         21Mi
metrics     metrics-server-5d78586d76-pbqj8            metrics-server          0m         10Mi
We can see that, this time, the output shows each container separately. We can, for example, observe metrics of the kube-dns-* Pod separated into three containers (kubedns, dnsmasq, sidecar).
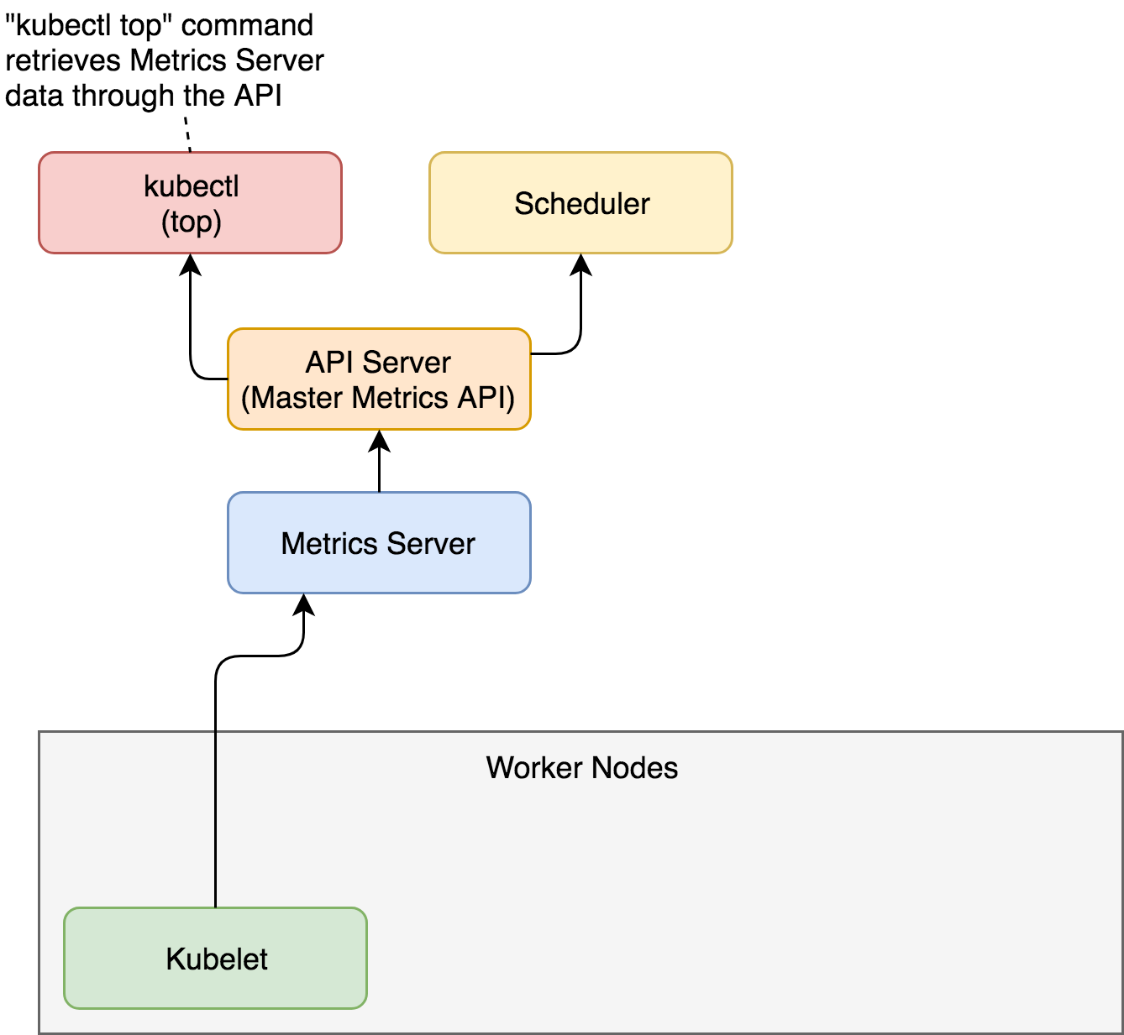
When we request metrics through kubectl top, the flow of data is almost the same as when the scheduler makes requests. A request is sent to the API Server (Master Metrics API), which gets data from the Metrics Server which, in turn, was collecting information from Kubeletes running on the nodes of the cluster.
While kubectl top command is useful to observe current metrics, it is pretty useless if we'd like to access them from other tools. After all, the goal is not for us to sit in front of a terminal with watch "kubectl top pods" command. That would be a waste of our (human) talent. Instead, our goal should be to scrape those metrics from other tools and create alerts and (maybe) dashboards based on both real-time and historical data. For that, we need output in JSON or some other machine-parsable format. Luckily, kubectl allows us to invoke its API directly in raw format and retrieve the same result as if a tool would query it.
 1  kubectl get \
 2      --raw "/apis/metrics.k8s.io/v1beta1" \
 3      | jq '.'
The output is as follows.
{
  "kind": "APIResourceList",
  "apiVersion": "v1",
  "groupVersion": "metrics.k8s.io/v1beta1",
  "resources": [
    {
      "name": "nodes",
      "singularName": "",
      "namespaced": false,
      "kind": "NodeMetrics",
      "verbs": [
        "get",
        "list"
      ]
    },
    {
      "name": "pods",
      "singularName": "",
      "namespaced": true,
      "kind": "PodMetrics",
      "verbs": [
        "get",
        "list"
      ]
    }
  ]
}
We can see that the /apis/metrics.k8s.io/v1beta1 endpoint is an index API that has two resources (nodes and pods).
Let's take a closer look at the pods resource of the metrics API.
 1  kubectl get \
 2      --raw "/apis/metrics.k8s.io/v1beta1/pods" \
 3      | jq '.'
The output is too big to be presented in a book, so I'll leave it up to you to explore it. You'll notice that the output is JSON equivalent of what we observed through the kubectl top pods --all-namespaces --containers command.
That was a rapid overview of the Metrics Server. There are two important things to note. First of all, it provides current (or short-term) memory and CPU utilization of the containers running inside a cluster. The second and the more important note is that we will not use it directly. Metrics Server was not designed for humans but for machines. We'll get there later. For now, remember that there is a thing called Metrics Server and that you should not use it directly (once you adopt a tool that will scrape its metrics).
Now that we explored Metrics Server, we'll try to put it to good use and learn how to auto-scale our Pods based on resource utilization.