
In this recipe we will see some basic configurations for the start window. We will talk about configuring the main window, file formats, and viewing options.
Start Wireshark, and you will get the start window. There are several parameters you can change here in order to adapt the capture window to meet your requirements:
Toolbars configuration
Main window configuration
Time format configuration
Name resolution
Colorize packet list
Auto scroll in live capture
Zoom
Columns configuration
Coloring rules
First, let's have a look at the toolbars that are used by the software:
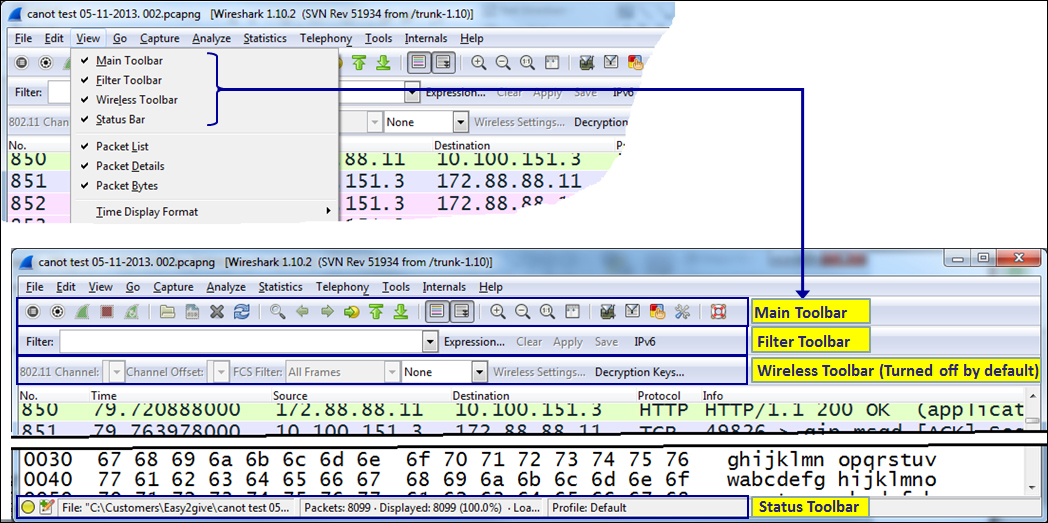
For operations with the other toolbars as follows, which are covered in the coming subsections in this recipe:
Main Toolbar
Display Filter Toolbar
Status Bar
In the main toolbar you have the icons shown in the following screenshot:
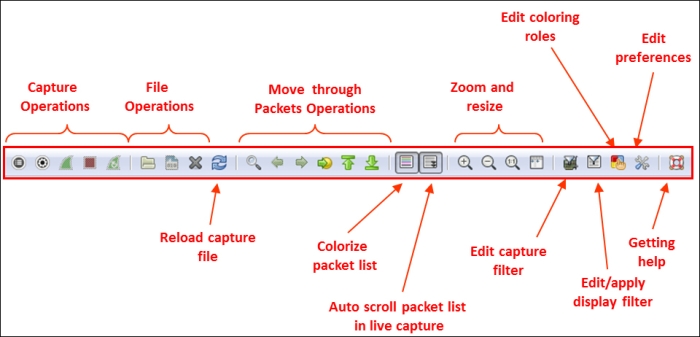
The five leftmost symbols are for capture operations, then you have symbols for file operations, zoom and "go to packet" operations, colorize and auto-scroll, zoom and resize, filters, preferences, and help.

In the status bar on the lower side of the Wireshark window, you can see the data shown in the following screenshot:
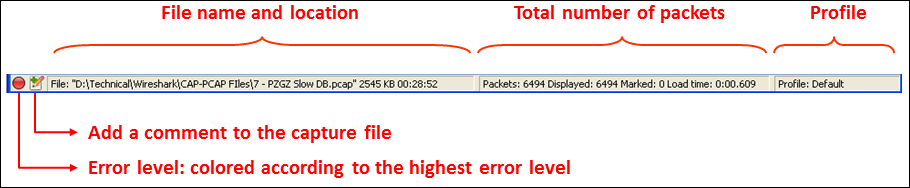
In the preceding screenshot you can see the following:
Errors in the expert system
The option to add a comment to the file
The name of the captured file (during capture, it will show you a temporary name assigned by the software)
Total number of captured packets, displayed packets (those which are actually displayed on the screen), and marked packets (those that you have marked).
In this part we will go step by step and configure the main menu.
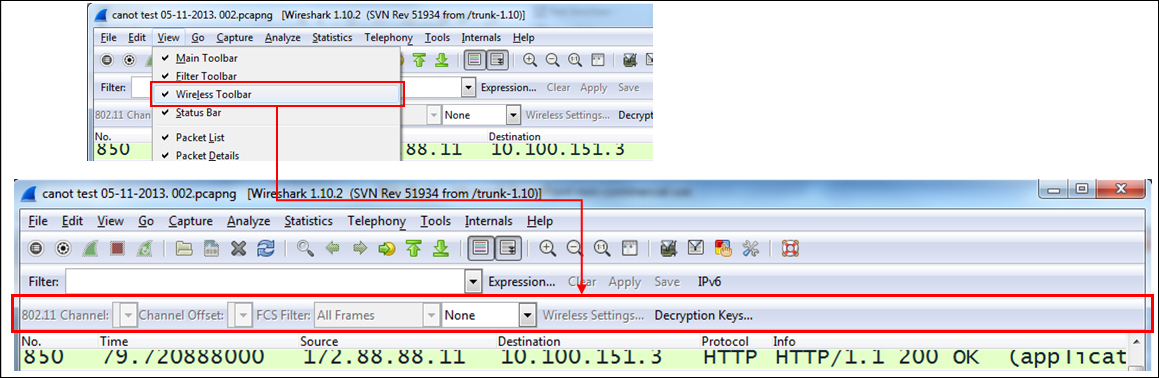
Usually for regular packet capture, you don't have to change anything. This is different when you want to capture wireless data over the network (not only from your laptop); you will have to enable the wireless toolbar, and this will be done by clicking on it under the view menu, as shown in the following screenshot:
To configure the main menu for capturing, you can configure Wireshark to show the following windows:
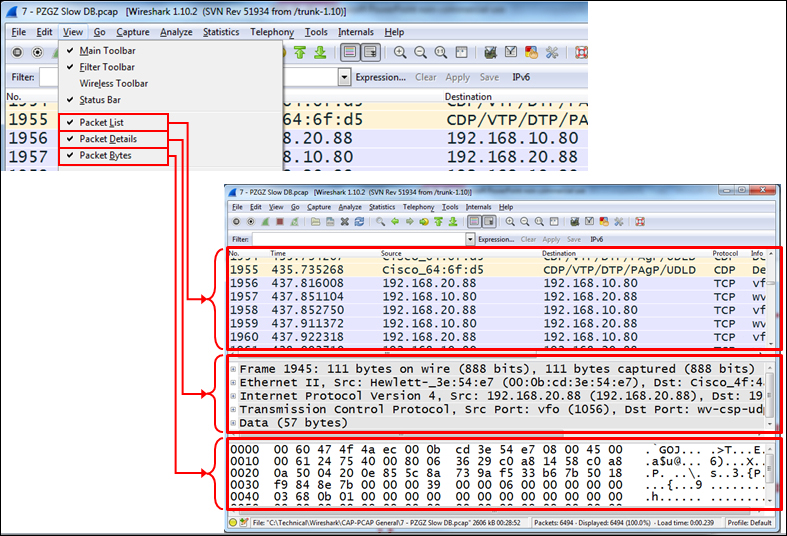
In most of the cases you will not need to change anything here. In some cases, you can cancel the packet bytes when you don't need to see them, and you will get more "space" for the packet list and details.
Name Resolution is the translation of layer 2 (MAC addresses), layer 3 (IP addresses), and layer 4 (Port numbers) into meaningful information.
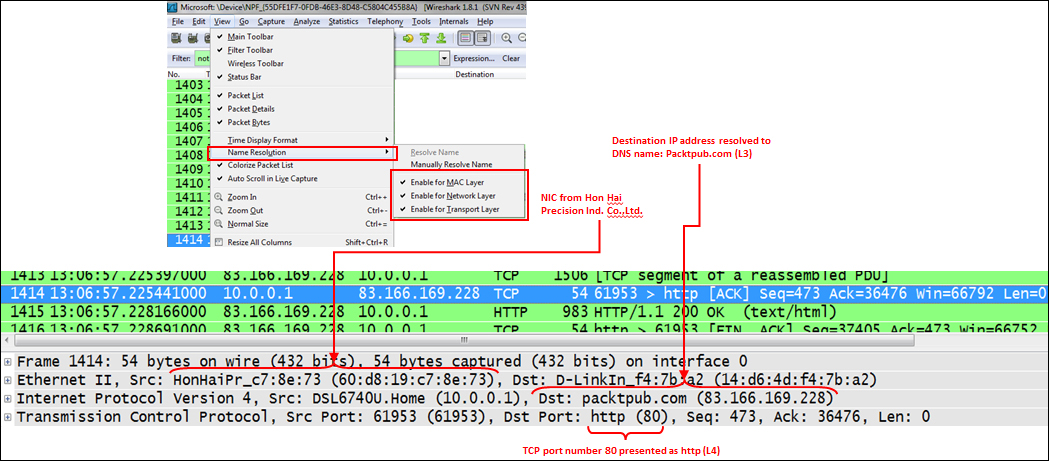
In the preceding screenshot, we see the MAC address 60:d8:19:c7:8e:73 (from Hon Hai Precision Ind., used by Lenovo), the website (that is, Packtpub.com), and the HTTP port number (that is 80).
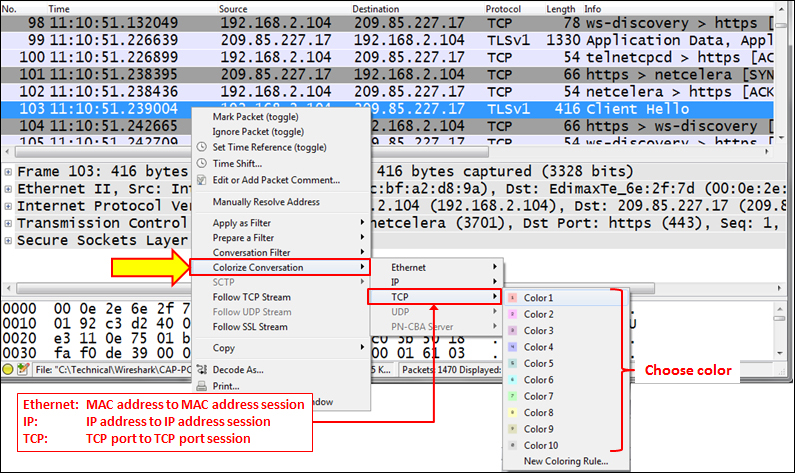
Usually you start a capture in order to establish a baseline profile of what normal traffic looks like on your network. During the capture, you look at the captured data and you might find a TCP connection, IP or Ethernet connectivity that are suspects, and you want to see them in another color.
To do so, right-click on the packet that belongs to the conversation you want to color, choose Ethernet, IP, or TCP/UDP (the appearance of TCP or UDP will depend on the packet), and choose the color for the conversation.
In the example you see that we want to color a Transport Layer Security (TLS) conversation.
For canceling the coloring rule:
Go to the View menu.
In the lower part of the menu, choose Reset Coloring 1-10 or simply click on Ctrl + Space bar.