Book Image

Zabbix 4 Network Monitoring - Third Edition

By : Patrik Uytterhoeven, Rihards Olups
Book Image

Zabbix 4 Network Monitoring - Third Edition

By: Patrik Uytterhoeven, Rihards Olups

Overview of this book

Zabbix 4 Network Monitoring is the perfect starting point for monitoring the performance of your network devices and applications with Zabbix. Even if you’ve never used a monitoring solution before, this book will get you up and running quickly. You’ll learn to monitor more sophisticated operations with ease and soon feel in complete control of your network, ready to meet any challenges you might face. Starting with the installation, you will discover the new features in Zabbix 4.0. You will then get to grips with native Zabbix agents and Simple Network Management Protocol (SNMP) devices. You will also explore Zabbix's integrated functionality for monitoring Java application servers and VMware. This book also covers notifications, permission management, system maintenance, and troubleshooting, so you can be confident that every potential challenge and task is under your control. If you're working with larger environments, you'll also be able to find out more about distributed data collection using Zabbix proxies. Once you're confident and ready to put these concepts into practice, you will understand how to optimize and improve performance. Troubleshooting network issues is vital for anyone working with Zabbix, so the book also helps you work through any technical snags and glitches you might face. By the end of this book, you will have learned more advanced techniques to fine-tune your system and make sure it is in a healthy state.
Table of Contents (25 chapters)

Using the web frontend configuration wizard

The web frontend has a wizard that helps you to configure its basics. Let's go through the simple steps it offers.

It's time to fire up a browser and navigate to Zabbix's address: http://<server_ip_or_name>/zabbix. It should work just fine in the latest versions of most browsers, including Firefox, Chrome, Safari, Opera, Konqueror, and Internet Explorer.

Step 1 – welcome

If everything has been configured properly, you should be greeted by the installation wizard:

If you are not, there are several things that could have gone wrong. If the connection fails completely, make sure Apache is started up and there is no firewall blocking access. If you see a blank page or some PHP code, make sure that PHP is properly installed and configured to parse files ending with the .php extension through the AddType application/x-httpd-php directive. If you see a file and directory listing instead of the installation wizard, make sure you have added index.php to the DirectoryIndex directive. If these hints do not help, check the PHP documentation at https://secure.php.net/manual/en/.

This screen doesn't offer us much to configure, so just click on Next step.

Step 2 – PHP prerequisites

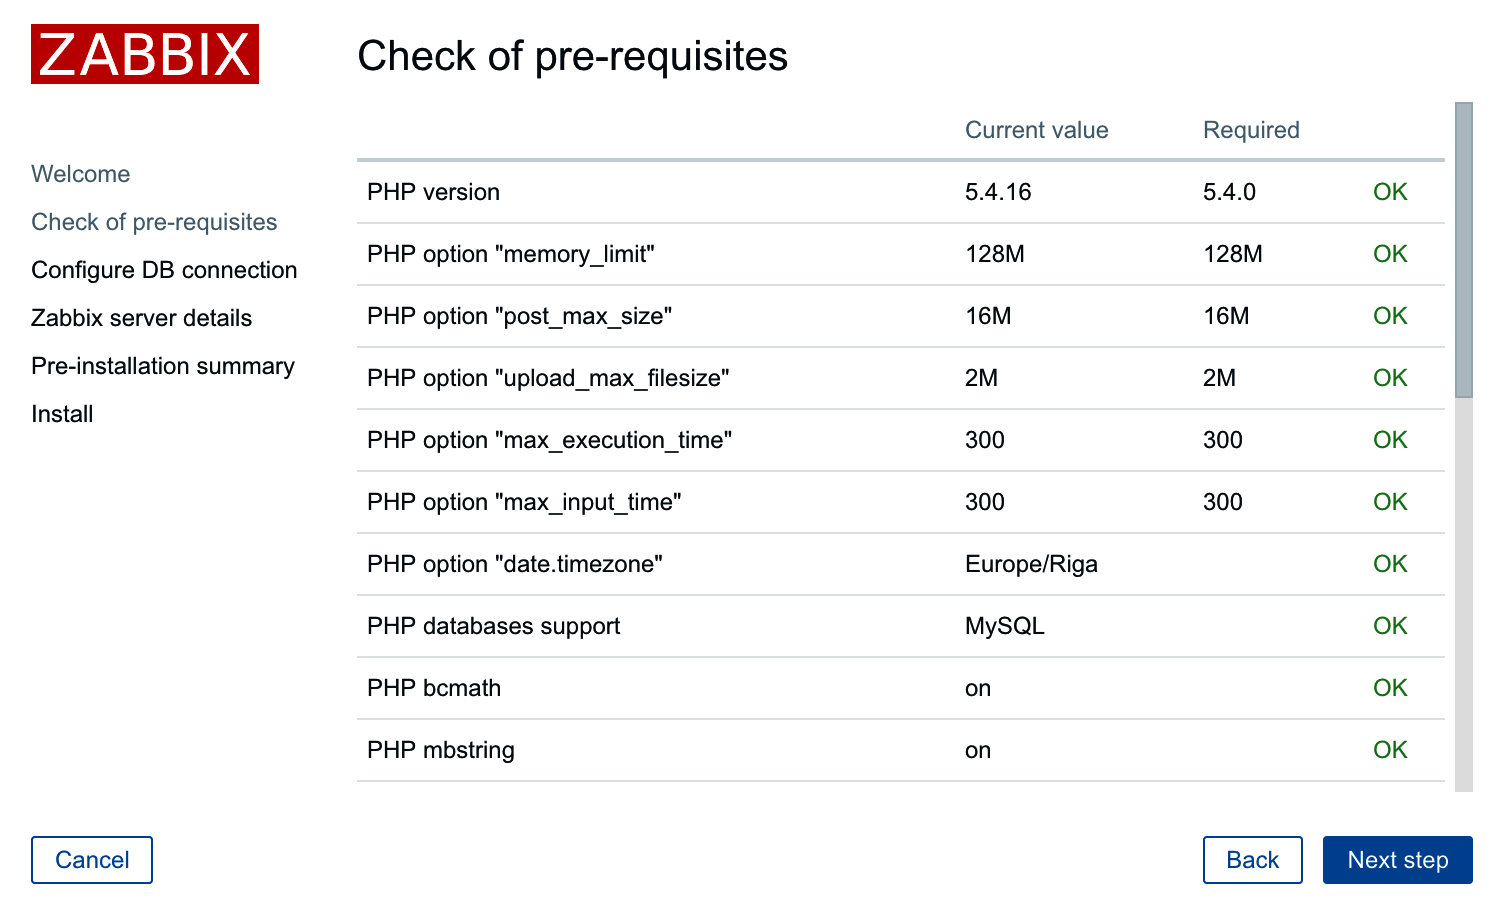
In this step, the installation wizard checks PHP-related prerequisites. If you are lucky, all will have been satisfied, and you will be greeted with all green entries:

If so, just click on the Next step button to continue to Step 3 – database access.

However, more often than not, one or more entries will have a red Fail warning listed next to them. This is where things get more interesting. Problems at this point fall into two categories—PHP installation or configuration.

Entries such as PHP version, PHP databases support, PHP bcmath, PHP mbstring, PHP gd, PHP gd PNG/JPEG/FreeType support, and others that are not listed as an option are PHP installation problems. To solve these, either install the appropriate distribution packages (sometimes called php5-bcmath, php5-gd, php5-mysql, and so on), or recompile PHP with the corresponding options.

PHP option "memory_limit", PHP option "post_max_size", PHP option "upload_max_filesize", PHP option "max_execution_time", PHP option "max_input_time", and PHP time zone are configuration issues that are all set in the php.ini configuration file. This file is usually located at /etc/php5 or similar for distribution packages and /usr/local/lib for PHP source installations. Set the following options:

max_execution_time 300
memory_limit 128M
post_max_size 16M
upload_max_filesize 2M
max_input_time 300
always_populate_raw_post_data -1
date.timezone Europe/Riga

For the time zone, set the date.timezone option to a time zone that best matches your environment. The default for Zabbix is Europe/Riga, and you can see valid options at http://www.php.net/manual/en/timezones.php.

Make sure you restart Apache after changing the PHP configuration file. If you can't find php.ini, or you make changes but the installation wizard does not pick them up, create a file named test.php in the htdocs directory with only this content:

<?php phpinfo() ?> 

Navigate to this file using your browser and check the value for a Configuration File (php.ini) Path entry—this is where you should look for php.ini.

Once everything is fixed, click on the Next step button to continue.

If you install from packages then you only have to edit the zabbix config file in your web server's config folder and after applying the correct changes restart your web server:

CentOS/Red Hat
# /etc/httpd/conf.d/zabbix.conf
Debian/Ubuntu
#/etc/apache2/conf-enabled/zabbix.conf

Step 3 – database access

Remember the database we created earlier? That's the information we'll supply here:

We already configured database credentials for the Zabbix server, but the Zabbix frontend uses a different configuration file. The default Database type, Database host, and Database port values should work for us. Set both Database name and User to zabbix. If you have forgotten the password, just look it up or copy it from zabbix_server.conf. After entering the data, click on the Next step button. If all of the information is correct, the wizard should proceed to the next step.

Step 4 – Zabbix server details

The next screen lets you specify the Zabbix server's location:

The defaults for the host and port are suitable for us, but we could benefit from filling in the Name field. The contents of this field will be used for page titles and a label in the upper-right corner of the Zabbix interface—this could be really handy if we had multiple Zabbix installations. Feel free to enter any name here, but for this book, we'll call the server Zabbix One. When you're done, it's over to the Next step again. The next screen is a summary of the choices made in the previous screens.

Step 5 – summary

If you left the defaults where appropriate and your database connection test was successful, it should be safe to continue by clicking on Next step:

Step 6 – writing the configuration file

It is quite likely that in the next screen, you will be greeted with failure:

The installation wizard attempted to save the configuration file, but with the access rights that it has, it should not be possible. Previous versions of Zabbix explained two alternatives for proceeding. Unfortunately, Zabbix 4.0 has lost the explanation for one of those. The two possible solutions are as follows:

  1. Click on Download the configuration file and manually place this file in the htdocs/zabbix/conf directory.
  2. Make the htdocs/zabbix/conf directory writable by the web server user (execute as root). Use these commands:
    # chown <username> /path/to/htdocs/zabbix/conf
    # chmod 700 /path/to/htdocs/zabbix/conf

Obviously, we need to insert the correct username and directory in these commands. Remember, common locations are /var/www/html and /usr/local/apache2/htdocs—use the one you copied the Zabbix frontend code to. Common users are wwwrun, www-data, nobody, and daemon—you can find out which one the correct user is for your system by running this:

$ ps aux | grep http

You could also run this:

$ ps aux | grep apache

The username that most httpd processes are running under will be the correct one. Once the permissions have been changed, click on Finish. That should successfully save the configuration file.

You can also skip the configuration wizard by copying zabbix.conf.php.example in the conf directory to zabbix.conf.php and editing it directly. In this case, you should manually verify that the PHP installation and configuration requirements have been met.

It is suggested that you restrict the permissions on this file afterwards to be readable only by the web server user, by issuing these commands as root:

# chmod 440 /path/to/htdocs/zabbix/conf/zabbix.conf.php
# chown root /path/to/htdocs/zabbix/conf/  

The file contains the database password, which is best kept secret.

Step 7 – finishing the wizard

Congratulations, this is the last wizard screen, which only wants you to be friendly to it and press Finish:

Step 8 – logging in

Immediately after clicking on Finish, you should see a login form:

The Zabbix database data that we inserted previously also supplied the default username and password. The default credentials are as follows:

  • Username: Admin
  • Password: zabbix

That should get you to the initial frontend screen, which drops you into a quite empty dashboard:

Congratulations! The web frontend is now set up and we have logged in.

It is possible to easily change the Zabbix frontend configuration later. The zabbix.conf.php configuration file can be edited to change database access details, the Zabbix server host and port, and the server name that we entered in the fourth step as well. Most of the parameters in that file should be self-explanatory; for example, $ZBX_SERVER_NAME will change the server name.

If you take a closer look at the upper-right corner, you'll spot something familiar: it's the server name we entered earlier in the configuration wizard. This makes it easier to distinguish this installation from other Zabbix instances; for example, if you had a testing and a production instance. Additionally, this name is also used in the page title, and hence in the tab title in most modern browsers. When multiple tabs are open, you should be able to see the instance name right there in the tab. There's no need to click on each tab individually and check the URL or upper-right corner of the Zabbix frontend:

The dashboard isn't too exciting right now, except maybe for that table labeled System information. The same view is also available somewhere else, thoughclick on Reports and then click on System information, the very first report:

Now we can concentrate on this widget. The frontend successfully sees that the Zabbix server is running and displays the host and port to which it is trying to connect. It also knows some basic things about Zabbix's configurationthere are 76 hosts configured in total. Wait, what's that? We have only set it up and have not configured anything; how can there be 76 hosts already? Let's take a closer look at the DETAILS column. These values correspond to the descriptions in parentheses located in the PARAMETER column. So, there are 0 monitored hosts, 1 that is not monitored, and 75 templates. Now that makes more sense75 of those 76 are templates, not actual hosts. Still, there's one host that isn't monitored, what's up with that?

Click on Configuration and choose Hosts. You should see the following screenshot:

The first thing to do here is click on that Filter button at the right side of the page. In the older versions of Zabbix, it was a huge button. As you can see, all filters are open by default; we will discuss and use filters later. For now, whenever you see a filter preceding the information we came for, just close it.

So, there it is. It turns out that the default Zabbix database already has one server configured—the local Zabbix server. It is disabled by default, as indicated in the System information screen and here by the Disabled string in the Status column.

There's a lot of technical details in the Zabbix online manual at https://www.zabbix.com/documentation/4.0/.