Book Image

Zabbix 4 Network Monitoring - Third Edition

By : Patrik Uytterhoeven, Rihards Olups
Book Image

Zabbix 4 Network Monitoring - Third Edition

By: Patrik Uytterhoeven, Rihards Olups

Overview of this book

Zabbix 4 Network Monitoring is the perfect starting point for monitoring the performance of your network devices and applications with Zabbix. Even if you’ve never used a monitoring solution before, this book will get you up and running quickly. You’ll learn to monitor more sophisticated operations with ease and soon feel in complete control of your network, ready to meet any challenges you might face. Starting with the installation, you will discover the new features in Zabbix 4.0. You will then get to grips with native Zabbix agents and Simple Network Management Protocol (SNMP) devices. You will also explore Zabbix's integrated functionality for monitoring Java application servers and VMware. This book also covers notifications, permission management, system maintenance, and troubleshooting, so you can be confident that every potential challenge and task is under your control. If you're working with larger environments, you'll also be able to find out more about distributed data collection using Zabbix proxies. Once you're confident and ready to put these concepts into practice, you will understand how to optimize and improve performance. Troubleshooting network issues is vital for anyone working with Zabbix, so the book also helps you work through any technical snags and glitches you might face. By the end of this book, you will have learned more advanced techniques to fine-tune your system and make sure it is in a healthy state.
Table of Contents (25 chapters)

Available metrics

With some groups and hosts automatically created, let's see what data they're collecting. Navigate to Monitoring | Latest data and select Hypervisors in the Host groups field. Then, click on Filter:

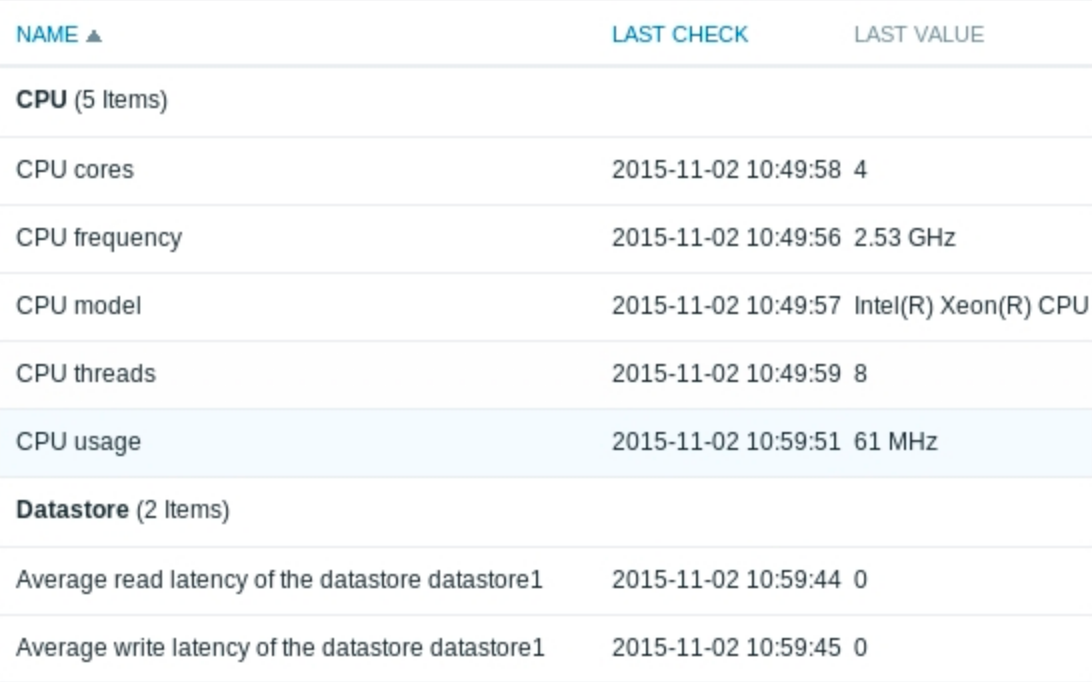
There'll be more items for each hypervisor. Some of them might not have data yet, but a bit of patience should reveal all of the details.

Datastore items might appear later; they're discovered by the datastore discovery LLD rule in Template VM VMware Hypervisor with a default interval of one hour.

Now, filter by hypervisor virtual machine group in the Host groups field or by a single discovered virtual machine in the Hosts field:

Again, there should be more items, and some could still be missing values. They all should eventually get populated, though.

Disks, filesystems, and interface items might appear later; they're discovered by the...