

Setting up JMX monitoring
Built into Zabbix is JMX monitoring, so we can monitor our Java applications. In this recipe, we'll check out how to monitor Apache Tomcat with Zabbix JMX so we can get a feel for what this monitoring option is all about.
Getting ready
To get ready for this recipe, we are going to need our Zabbix server to monitor our JMX application.
I also used a CentOS 7 machine for this recipe, with Tomcat installed. It can be quite tricky to use Tomcat on CentOS 8 due to package dependencies, so I recommend sticking with 7 for now. You can add the following to your Tomcat configuration after installation to get it working in our recipe:
JAVA_OPTS="-Djava.rmi.server.hostname=10.16.16.155 -Dcom.sun.management.jmxremote -Dcom.sun.management.jmxremote.port=12345 -Dcom.sun.management.jmxremote.authenticate=false -Dcom.sun.management.jmxremote.ssl=false"
How to do it…
To set up JMX monitoring, we are going to add a host to our Zabbix server that will monitor our Apache Tomcat installation. But first, we will need to add some settings to our /etc/zabbix/zabbix_server.conf file:
- Let's edit the
zabbix_server.conffile by logging in to our Zabbix server and executing the following command:Vim /etc/zabbix/zabbix_server.conf
- We will then need to add the following lines to this file:
JavaGateway=127.0.0.1
StartJavaPollers=5
- We will also need to install the
zabbix-java-gatewayapplication on our Zabbix server with the following command:dnf install zabbix-java-gateway systemctl start zabbix-java-gateway systemctl restart zabbix-server
That is all we need to do on the server side of things to get JMX monitoring to work. Zabbix doesn't include these settings by default, so this is why we need to add the text to our file and install the application.
- To get started with monitoring our JMX host, go to Configuration | Hosts in your Zabbix frontend and click Create host in the top-right corner.
We will then add a host with the following settings:

Figure 2.36 – Zabbix item configuration page
- Let's also make sure to add the following template to our host so we can actually start monitoring the JMX host:

Figure 2.37 – Zabbix host template page
- After this, our JMX icon should turn green; let's check this under Monitoring | Hosts. It should look like this:

Figure 2.38 – Zabbix hosts page
- If we click on the Latest data for our new JMX monitored host, we should also see our incoming data. Check it out; it should return stats like these:
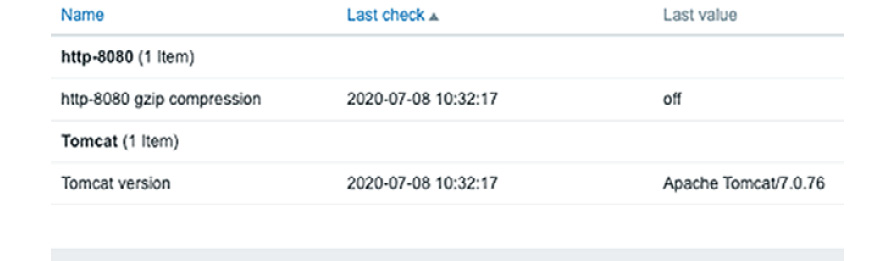
Figure 2.39 – Zabbix Latest data
How it works…
Zabbix utilizes a Java gateway either hosted on Zabbix server itself or hosted on another server (proxy) to monitor JMX applications:

Figure 2.40 – Communication diagram between Zabbix server and Java
Zabbix polls the Java gateway and the Java gateway in turn communicates with our JMX application, as it does with Tomcat in our example. The data in turn is then returned through the same path and we can see our data in our Zabbix server.
See also
There are loads of applications that can be monitored through Zabbix JMX. Check out the Zabbix monitoring and integrations page for more uses of Zabbix JMX monitoring: https://www.zabbix.com/integrations/jmx.