
Setting up database monitoring
Databases are a black hole to a lot of engineers; there's data being written to them and there's something being done with this data. But what if you want to know more about the health of your database? That's where Zabbix database monitoring comes in – we can use it to monitor the health of our database to a greater extent.
Getting ready
We'll be monitoring our Zabbix database, for convenience. This means that all we are going to need is our installed Zabbix server with our database on it. We'll be using MariaDB in this example, so if you have a PostgreSQL setup, make sure to install a MariaDB instance on a Linux host.
How to do it…
Before getting started with the item configuration, we'll have to do some stuff on the CLI side of the server:
- Let's start by installing the required modules to our server:
dnf install unixODBC mariadb-connector-odbc
- Now let's verify whether our ODBC configuration files exist:
odbcinst -j
Your output should look as follows:
unixODBC 2.3.7
DRIVERS............: /etc/odbcinst.ini
SYSTEM DATA SOURCES: /etc/odbc.ini
FILE DATA SOURCES..: /etc/ODBCDataSources
USER DATA SOURCES..: /root/.odbc.ini
SQLULEN Size.......: 8
SQLLEN Size........: 8
SQLSETPOSIROW Size.: 8
- If the output is correct, we can go to the Linux CLI and continue by editing
odbc.inito connect to our database:vim /etc/odbc.ini
Now fill in your Zabbix database information. It will look like this:
[book]
Description = MySQL book test database
Driver      = mariadb
Server      = 127.0.0.1
User        = zabbix
Password    = password
Port        = 3306
Database    = zabbix
- Now let's test whether our connection is working as expected by executing this:
isql book
You should get a message saying Connected; if you don't, then check your configuration files and try again.
- Now let's move to the Zabbix frontend to configure our first database check. Navigate to Configuration | Hosts and click the host called lar-book-centos, or it might still be called Zabbix server. Now go to Items; we want to create a new item here by clicking the Create item button.
Tip
If you haven't already, a great way to keep your Zabbix structured is to keep all hostnames in Zabbix equal to the real server hostname. Rename your default Zabbix server host in the frontend to what you've actually called your server.
We want to add an item with the following parameters:

Figure 2.41 – Zabbix item configuration page, items in Zabbix database
- Now if you go to Monitoring | Hosts and click the Latest data for our host, you'll get to see this:
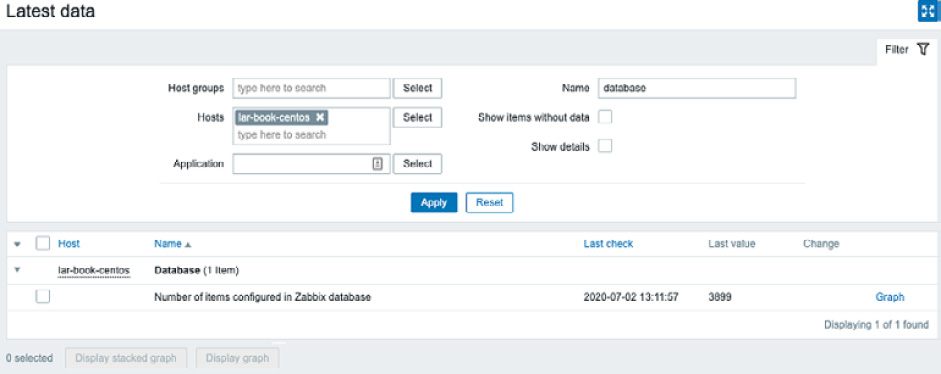
Figure 2.42 – Zabbix Latest data page for host lar-book-centos, items in Zabbix database
We can now see directly from the database how many items are written to it.
How it works…
The Zabbix database monitoring works by connecting to your database with the ODBC middleware API. Any database supported by ODBC can be queried with Zabbix database monitoring:
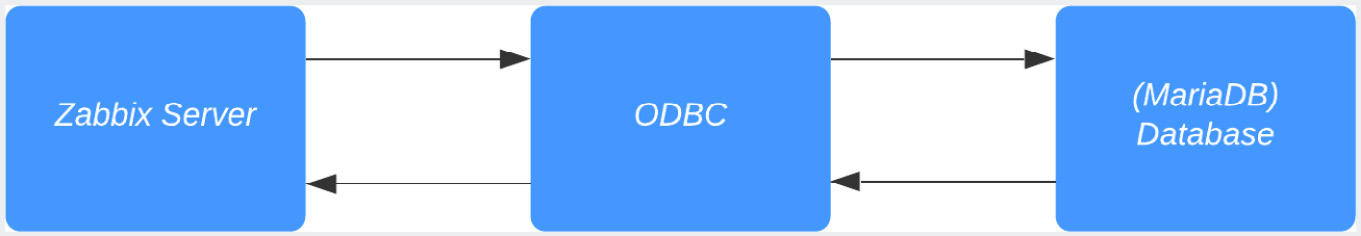
Figure 2.43 – Diagram showing Zabbix server ODBC communication
Basically, your Zabbix server sends a command with, for instance, your MySQL query to the ODBC connector. Your ODBC connecter sends this query to the database, which in turn returns a value to ODBC. ODBC then forwards the value to Zabbix server and hey presto: we have a value under our item.
There's more…
You can do loads of queries to your databases with Zabbix database monitoring, but keep in mind that you are working with actual queries. Querying a database takes time and processing power, so keep your database monitoring structured and define the right execution times.