

Troubleshooting logs and log forwarding
Each log entry has multiple time indications that not only track when a session started and how long it lasted, but also when it was processed by the log receiver:
- Start Time is the timestamp when the session was accepted by the firewall.
- Generate Time: This is the timestamp for when the log file was generated. A log is generated based on the log action that was set in the security rule:
Log at session start will Generate Time for each "start" event, such as the session being accepted, but also every time the App-ID changes. In this case, multiple logs will be generated for the same session, all with the same start time, but having a progressively later Generate Time.
Log at session end will Generate Time when the session has ended.
Receive Time is when the log is received and written to a log database by the logreceiver daemon; this happens when the data plane hands the log over to the management plane to be written into the log database, or in the case of Panorama, when it is received from the firewall on Panorama.
As shown in the following screenshot, the Receive Time property of Panorama is several hours after Generate Time, which could be an indication of several possible issues. There could be a time mismatch between the firewall and Panorama, so make sure both systems are set to the proper time zone and have NTP enabled so that the system's time is kept synchronized. The firewall could have been disconnected from Panorama, so check the System logs to see if the firewall was disconnected at one point:
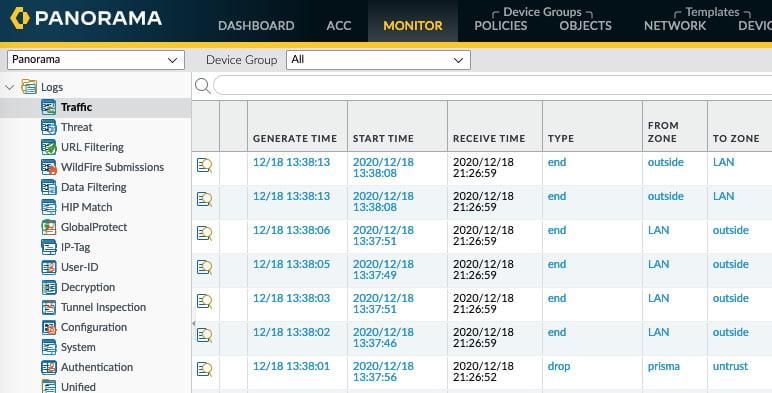
Figure 1.24 – Time indications in log entries
Debugging log-receiver
To find out if there is an issue on the firewall, run the debug log-receiver statistics command to review the overall health of the log-receiver daemon. If it is receiving an extremely large volume of logs, it may have difficulty writing all of them in a timely manner. It will start queueing logs and if the queue is filled to the limit, logs will be discarded. Take note of Log incoming rate versus Log written rate and keep the Logs discarded (queue full) counters in mind to determine if log generation is too high on the firewall.
For log forwarding issues, review Log Forward discarded (queue full) count and Log Forward discarded (send error) count.
If the data plane is somehow sending corrupted log entries, those will be recorded here as well. If there is an issue with the log partition, you will see the count of Logs not written since disk became unavailable increase:
reaper@PANgurus> debug log-receiver statistics
Logging statistics
------------------------------ -----------
Log incoming rate:             1/sec
Log written rate:              1/sec
Corrupted packets:             0
Corrupted URL packets:         0
Corrupted HTTP HDR packets:    0
Corrupted HTTP HDR Insert packets: 0
Corrupted EMAIL HDR packets:   0
Logs discarded (queue full):   0
Traffic logs written:          382902
Tunnel logs written:           186
Auth logs written:             0
Userid logs written:           0
GlobalProtect logs written:    5
DECRYPTION logs written:       79
URL logs written:              232716
Wildfire logs written:         2
Anti-virus logs written:       0
Wildfire Anti-virus logs written: 0
Spyware logs written:          0
Spyware-DNS logs written:      0
Attack logs written:           0
Vulnerability logs written:    380
Data logs written:             0
URL cache age out count:       0
URL cache full count:          0
URL cache key exist count:     4049
URL cache wrt incomplete http hdrs count: 0
URL cache rcv http hdr before url count: 0
URL cache full drop count(url log not received): 0
URL cache age out drop count(url log not received): 0
Traffic alarms dropped due to sysd write failures: 0
Traffic alarms dropped due to global rate limiting: 0
Traffic alarms dropped due to each source rate limiting: 0
Traffic alarms generated count:  0
Log Forward count:             249
Log Forward discarded (queue full) count: 0
Log Forward discarded (send error) count: 0
Total logs not written due to disk unavailability: 0
Logs not written since disk became unavailable: 0
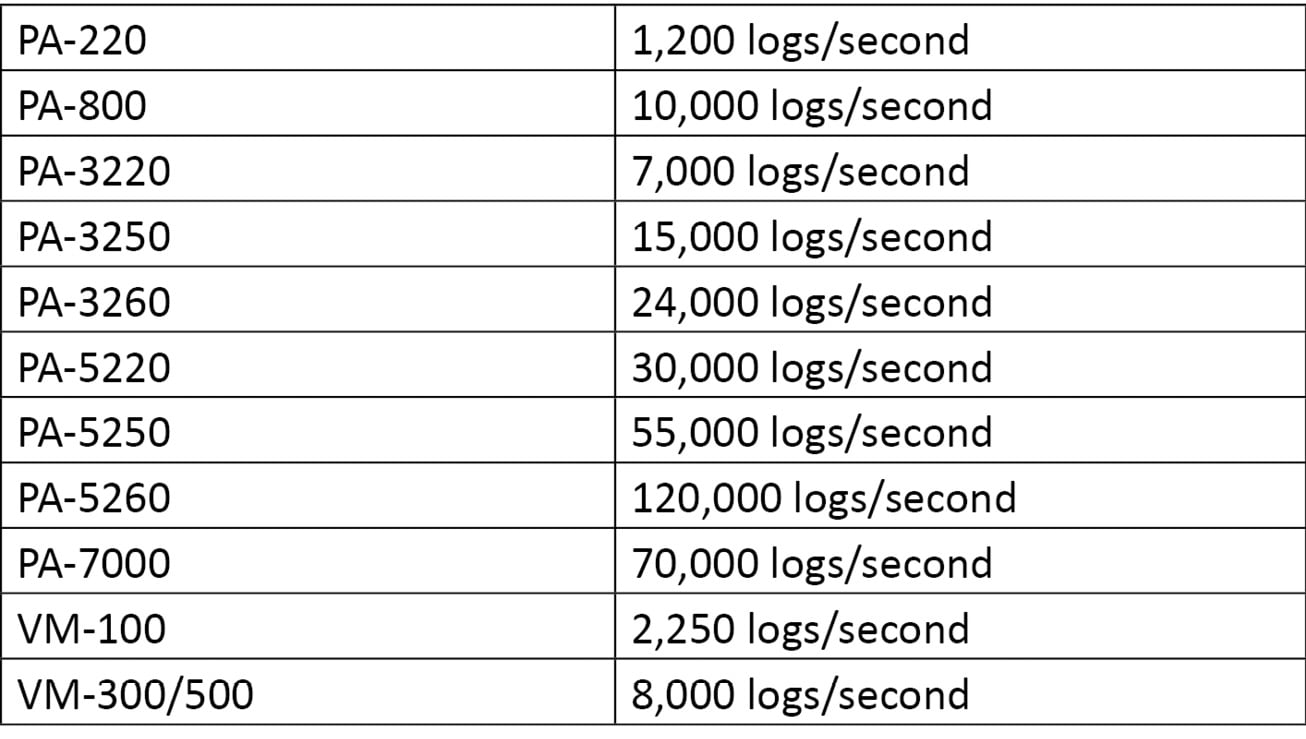
The following are some indications of the maximum supported log rates per device. New PAN-OS upgrades may come with new supported log rates, so please check the release notes to ensure there are no changes:
If the total volume of logs is too high, you can review the queue statistics with the debug log-receiver queue_stats command. This ensures that this conclusion is accurate:
reaper@PANgurus> debug log-receiver queue_stats
Logging statistics
------------------------------ -----------
Log incoming rate:             6/sec
Log written rate:              6/sec
Logs discarded (queue full):   0
Ring buffer entries:           0/16383
Traffic taskqs:
    comp_taskq:                0/64
    disk_flush_taskq:          0/64
    summary_calc_taskq:        0/64
    summary_flush_taskq:       0/1
    bdx_taskqs[ 0]:            0/128
    bdx_taskqs[ 1]:            0/128
    bdx_taskqs[ 2]:            0/128
    bdx_taskqs[ 3]:            0/128
Threat taskqs:
    comp_taskq:                0/64
    disk_flush_taskq:          0/64
    summary_calc_taskq:        0/64
    summary_flush_taskq:       0/1
    bdx_taskqs[ 0]:            0/128
    bdx_taskqs[ 1]:            0/128
    bdx_taskqs[ 2]:            0/128
    bdx_taskqs[ 3]:            0/128
Next, we will learn about reading system resources.
Reading system resources
To verify whether the system is having I/O issues reading and writing to the disk, you can review some parameters in show system resources. To see the output live, add follow to the command and press 1 to see all CPU cores.
The output is similar to the output of top in Linux and will return the load and memory usage of the system, as well as a list of all the running processes and their resource demands.
As shown in the following screenshot, cores 1 and 2 are 100% loaded, and there are two processes taking up 100% of CPU capacity. In this case, this is due to the chassis being a PA-220, which shares a single quad-core CPU between the data plane and the management plane. pan_task processes are packet processing daemons that are pre-spun up, so it is expected that they take up about 100% of the CPU cycles:
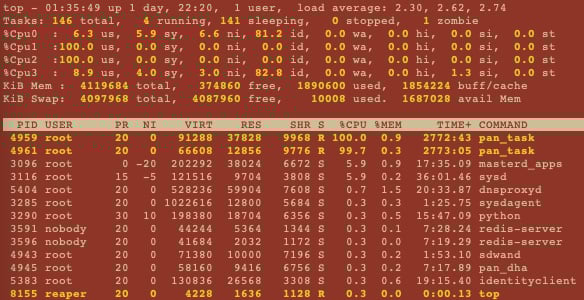
Figure 1.25 – Show system resources
For logging issues, ensure the logrcvr process does not appear to be stuck or taking up more resources than expected. The value under the VIRT column represents memory usage in KB and should not run into the GB range.
The wa value next to the CPU readings represents the time spent waiting on disk I/O and should be as close to 0 as possible. A high value, such as over 10%, could indicate a disk problem.
Ideally, there should be a little memory left in both free values, but if you run out of volatile memory, the system will start to swap. Requiring a swap may introduce latency, but when the swap space is depleted, the system will start to degrade severely. If the swap is depleted, look down the list for the process that is taking up all this memory under the VIRT column and consider restarting it using the debug software restart process command, followed by the process name. If these issues present themselves regularly, check if your current PAN-OS requires an upgrade or consider upgrading the firewall to a larger platform that can process more logs.
Using tcpdump
If the system resources and logrcvr stats look healthy, you may be facing an external issue. The connection to the external system may be unreliable or have a lower-than-expected MTU, which could cause logs to be queued up, discarded along the way, or fragmented.
Capturing packets on both ends is usually the best way to find out if something is happening on the network connecting both systems to each other. On the management plane, you can use the tcpdump command followed by a filter. Older PAN-OS limited the default size per packet to 64 bytes, so take note of the capture size and add snaplen 0 to capture whole packets if the capture size is limited.
Unlike tcpdump in Linux systems, there is no need to add an interface as only the management interface (eth0) can be captured. Filters are added between double quotes:
reaper@PANgurus> tcpdump filter "tcp port 514"
Press Ctrl-C to stop capturing
tcpdump: listening on eth0, link-type EN10MB (Ethernet), capture size 65535 bytes
^C
10 packets captured
10 packets received by filter
0 packets dropped by kernel
reaper@PANgurus>
The available filters are similar to their Linux tcpdump counterparts; that is, host 10.0.0.1, src net 10.0.0.0/24/24, and tcp port 22. You can add operators to include or exclude attributes, but not port 22.
You can then view packetcapture via CLI using the view-pcap mgmt-pcap mgmt.pcap command. You can add some parameters, such as the following:
no-dns-lookup yes, to not resolve IP addresses to hostnamesno-port-lookup yes, to display the actual port number instead of a nameverbose++ yes, to add more detailsno-timestamp yes, to leave out the timestamp:
reaper@PANgurus> view-pcap no-dns-lookup yes no-port-lookup yes no-timestamp  yes mgmt-pcap mgmt.pcap
IP 192.168.27.115.47055 > 192.168.27.7.514: Flags [P.], seq 3534228492:3534228807, ack 3260149837, win 115, length 315
IP 192.168.27.7.514 > 192.168.27.115.47055: Flags [.], ack 315, win 8211, length 0
IP 192.168.27.115.47055 > 192.168.27.7.514: Flags [P.], seq 315:632, ack 1, win 115, length 317
IP 192.168.27.7.514 > 192.168.27.115.47055: Flags [.], ack 632, win 8210, length 0
IP 192.168.27.115.47055 > 192.168.27.7.514: Flags [P.], seq 632:949, ack 1, win 115, length 317
IP 192.168.27.7.514 > 192.168.27.115.47055: Flags [.], ack 949, win 8208, length 0
IP 192.168.27.115.47055 > 192.168.27.7.514: Flags [P.], seq 949:1269, ack 1, win 115, length 320
IP 192.168.27.7.514 > 192.168.27.115.47055: Flags [.], ack 1269, win 8207, length 0
IP 192.168.27.115.47055 > 192.168.27.7.514: Flags [P.], seq 1269:1828, ack 1, win 115, length 559
IP 192.168.27.7.514 > 192.168.27.115.47055: Flags [.], ack 1828, win 8212, length 0
The pcap file can also be exported to an SCP or TFTP server so that it can be inspected using a tool such as Wireshark using the tftp export mgmt-pcap from mgmt.pcap to <host> or scp export mgmt-pcap from mgmt.pcap to user@host/path/ commands:
reaper@PANgurus> tftp export mgmt-pcap from mgmt.pcap to 192.168.27.7
mode set to octet
Connected to 192.168.27.7 (192.168.27.7), port 69
putting /opt/pan/.debug/mgmtpcap/mgmt.pcap to 192.168.27.7:mgmt.pcap [octet]
Sent 2582 bytes in 0.0 seconds [805931 bit/s]
In the next section, we will take a closer look at troubleshooting log forwarding issues to a Panorama log collector.
Troubleshooting forwarding to a log collector
To verify that the firewall is connected to Panorama, you can run the following command to check the status of the log collector agent:
debug management-server log-collector-agent-status
The output will clearly state which log collectors are known and if the firewall is currently connected to them:
reaper@PANgurus> debug management-server log-collector-agent-status
Logcollector agent status
-------------------------
Serial  IP Address  Connected  Last Disconn Time  Failed conns
-------------------------
0007001 192.168.27.10     no                                 0
Important Note
The firewall will always initiate the connection toward Panorama and additional log collectors. Any commands, updates, or configuration originating from Panorama or a log collector will be backhauled over the connection established by the firewall.
You can then check additional information by running request log-collector-forwarding status. As shown in the following screenshot, it will show timestamps for certain events, such as when it last registered and connected to the log collector, but also the timestamp when the last log was forwarded. A large gap between the current time and the last time a log (most commonly, traffic and a threat) was forwarded, or a very short time between when the last connection was established and the current time, could be an indication of connectivity issues. Take note of Last Seq Num Fwded and Last Seq Num Acked as you will need to compare these log sequence numbers on the log collector:
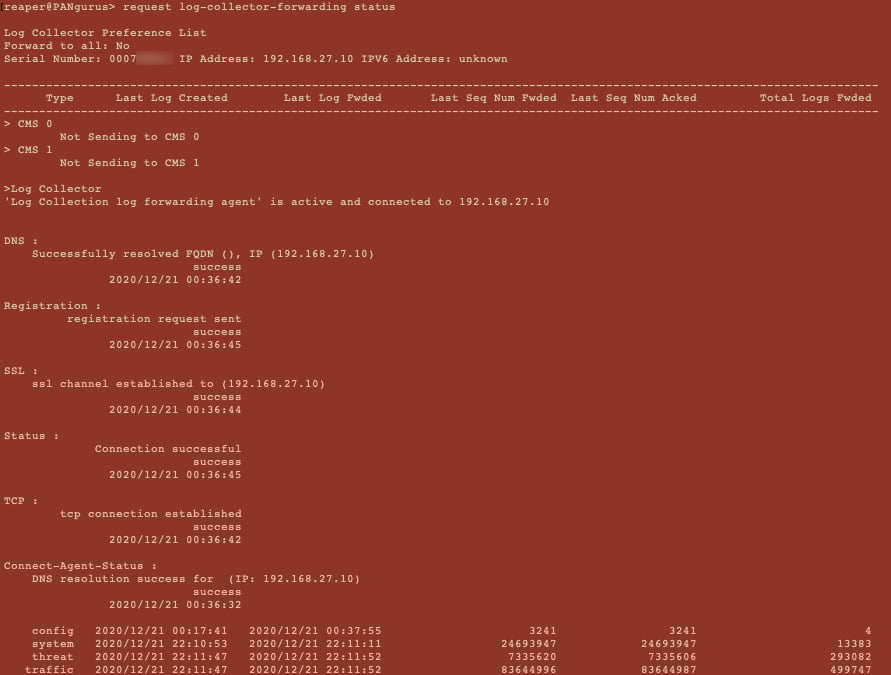
Figure 1.26 – Log collector forwarding status
On Panorama, you can verify if the log collector is connected and whether it received the latest configuration, in case something changed, using the show log-collector connected command:
reaper@Panorama> show log-collector connected
Serial  CID Hostname  Connected Config Status SW Version         IPv4 - IPv6
--------------------------------------------------------------
0007001 2   Panorama  yes       In Sync       10.0.3             192.168.27.10 - unknown
Redistribution status:       none
Last commit-all: commit succeeded, current ring version 1
SearchEngine status:     Active
md5sum  updated at ?
  Certificate Status:
  Certificate subject Name:
  Certificate expiry at: none
  Connected at: none
  Custom certificate Used: no
  Last masterkey push status: Unknown
  Last masterkey push timestamp:  none
Once you've verified that the collector is connected and in sync, you can check the statuses of the firewalls sending logs to Panorama using show logging-status device <serial of firewall>. You will see the timestamp of the last logs that were received and which sequence number was received:
reaper@Panorama> show logging-status device 012000001
    Type            Last Log Rcvd    Last Seq Num Rcvd       Last Log Generated
Source IP         : Default
Destination IP    : Default
Source Daemon     : unknown
Connection Id      : 012000001-log-collection
Log rate: 1
    config      2020/12/21 00:37:55                3241      2020/12/21 00:17:41
    system      2020/12/21 22:34:55            24693983      2020/12/21 22:34:49
    threat      2020/12/21 22:35:15             7336943      2020/12/21 22:35:10
   traffic      2020/12/21 22:35:15            83646677      2020/12/21 22:35:10
    userid                      N/A                 N/A                       N/A
     iptag      2020/12/21 22:35:15               14127      2020/12/21 22:35:07
You can check the current flow rate of incoming logs by running the debug log-collector log-collection-stats show incoming-logs command.
At the bottom, it will also indicate if there are logs being discarded from devices, which can be an indication that the log rate is too high:
reaper@Panorama> debug log-collector log-collection-stats show incoming-logs
Last time logs received Mon Dec 21 23:00:20 2020
Incoming log rate =   1.10
Detail counts by logtype:
traffic:60936
config:16
system:2650
threat:32723
...
Inbound logger stats:
traffic generation logcount:60936 blkcount:926 addition-rate:0(per sec)
config generation logcount:16 blkcount:2 addition-rate:0(per sec)
system generation logcount:2650 blkcount:638 addition-rate:0(per sec)
threat generation logcount:32723 blkcount:922 addition-rate:0(per sec)
...
Num of discarded log messages from devices: 0
If there has been a connectivity outage between the firewall and Panorama, the firewall will try to send all its logs starting from the last acked (acknowledged by Panorama that it was received) sequence number. If the disconnection was lengthy, the firewall may need to send a vast volume of logs across, which could lead to more congestion or a long wait time for old logs to catch up and fresh logs to become visible on Panorama. There are a few commands available to control how the firewall will forward its backlog, all of which you can initiate from Panorama.
This command will tell the firewall to stop sending logs:
request log-fwd-ctrl device <FW serial> action stop
scheduled a job with jobid 0.
0
The following command will tell the firewall to start forwarding logs again, from the last acked log, and buffer any future logs if a disconnect were to happen again. This is the default setting for log forwarding:
request log-fwd-ctrl device <FW serial> action start
scheduled a job with jobid 0. Converted log-fwd-ctrl action to 'start-from-lastack'
0
The following command will instruct the firewall to start sending logs, starting from the latest sequence number, working its way back. This can help you get newer logs faster while allowing yourself some time to catch up on old logs:
request log-fwd-ctrl device <FW serial> action latest
scheduled a job with jobid 0.
0
The following command will tell the firewall to start forwarding live logs only. It will not attempt to forward the buffered logs. If a disconnect happens again, the firewall will not buffer logs during this outage and will simply continue from the latest log once connectivity is re-established:
request log-fwd-ctrl device <FW serial> action live
scheduled a job with jobid 0.
0
This will tell the firewall to start regular log forwarding again, starting from the last acked log file. This command can be executed after the action live command to pick up logging, but with buffering enabled:
request log-fwd-ctrl device <FW serial> action start-from-lastack
scheduled a job with jobid 0.
0
Let's look at a few examples of how these commands could be leveraged during troubleshooting.
If there is an issue with catching up on the buffered logs, due to bandwidth constraints or because the load on Panorama is too high due to a high log ingestion rate, it may be necessary to abandon the buffered logs. The sequence to achieve this is to stop logging and then start logging live. Then after a few minutes, when you've verified that fresh logs are coming in, execute start-from-lastack so that the buffer is active in case there is another short disconnect.
If the log rate is too high at a peak moment, logging could be stopped for a less critical firewall to reduce the load on the log collector and restarted once the peak has faded away. Buffering will ensure no logs are lost.
In some cases, the log rate on the firewall may be so high, or the outage may be so long, that the firewall was unable to keep the oldest logs and the last ack log was purged. In this case, start and start-from-lastack could have trouble restarting as the sequence numbers no longer match up. Here, try latest or run live for a few minutes, followed by start-from-lastack.
Check if your commands are causing the expected log action by executing show logging-status device <FW serial>.