Sign In Start Free Trial
Account

Add to playlist

Create a Playlist

Modal Close icon
You need to login to use this feature.
  • Book Overview & Buying Cloud-Native Observability with OpenTelemetry
  • Table Of Contents Toc
Cloud-Native Observability with OpenTelemetry

Cloud-Native Observability with OpenTelemetry

By : Boten
4.8 (8)
close
close
Cloud-Native Observability with OpenTelemetry

Cloud-Native Observability with OpenTelemetry

4.8 (8)
By: Boten

Overview of this book

Cloud-Native Observability with OpenTelemetry is a guide to helping you look for answers to questions about your applications. This book teaches you how to produce telemetry from your applications using an open standard to retain control of data. OpenTelemetry provides the tools necessary for you to gain visibility into the performance of your services. It allows you to instrument your application code through vendor-neutral APIs, libraries and tools. By reading Cloud-Native Observability with OpenTelemetry, you’ll learn about the concepts and signals of OpenTelemetry - traces, metrics, and logs. You’ll practice producing telemetry for these signals by configuring and instrumenting a distributed cloud-native application using the OpenTelemetry API. The book also guides you through deploying the collector, as well as telemetry backends necessary to help you understand what to do with the data once it's emitted. You’ll look at various examples of how to identify application performance issues through telemetry. By analyzing telemetry, you’ll also be able to better understand how an observable application can improve the software development life cycle. By the end of this book, you’ll be well-versed with OpenTelemetry, be able to instrument services using the OpenTelemetry API to produce distributed traces, metrics and logs, and more.
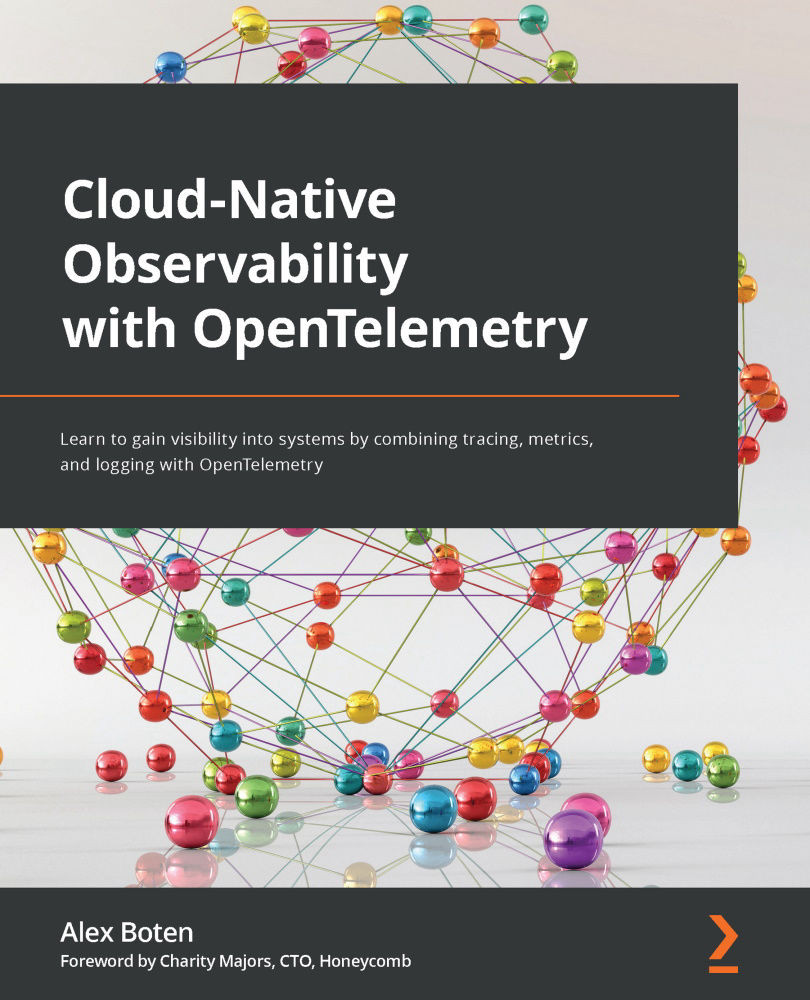
Table of Contents (17 chapters)
close
close
1
Section 1: The Basics
3
Chapter 2: OpenTelemetry Signals – Traces, Metrics, and Logs
5
Section 2: Instrumenting an Application
10
Section 3: Using Telemetry Data

Chapter 11: Diagnosing Problems

Finally, after instrumenting application code, configuring a collector to transmit the data, and setting up a backend to receive the telemetry, we have all the pieces in place to observe a system. But what does that mean? How can we detect abnormalities in a system with all these tools? That's what this chapter is all about. This chapter aims to look through the lens of an analyst and see what the shape of the data looks like as events occur in a system. To do this, we'll look at the following areas:

  • How leaning on chaos engineering can provide the framework for running experiments in a system
  • Common scenarios of issues that can arise in distributed systems
  • Tools that allow us to introduce failures into our system

As we go through each scenario, we'll describe the experiment, propose a hypothesis, and use telemetry to verify whether our expectations match what the data shows us. We will use the data and become more...

CONTINUE READING
83
Tech Concepts
36
Programming languages
73
Tech Tools
Icon Unlimited access to the largest independent learning library in tech of over 8,000 expert-authored tech books and videos.
Icon Innovative learning tools, including AI book assistants, code context explainers, and text-to-speech.
Icon 50+ new titles added per month and exclusive early access to books as they are being written.
Cloud-Native Observability with OpenTelemetry
notes
bookmark Notes and Bookmarks search Search in title playlist Add to playlist download Download options font-size Font size

Change the font size

margin-width Margin width

Change margin width

day-mode Day/Sepia/Night Modes

Change background colour

Close icon Search
Country selected

Close icon Your notes and bookmarks

Confirmation

Modal Close icon
claim successful

Buy this book with your credits?

Modal Close icon
Are you sure you want to buy this book with one of your credits?
Close
YES, BUY

Submit Your Feedback

Modal Close icon
Modal Close icon
Modal Close icon