
Understanding the history of OpenTelemetry
In early 2019, the OpenTelemetry project was announced as a merger of two existing open source projects: OpenTracing and OpenCensus. Although initially, the goal of this endeavor was to bring these two projects together, its ambition to provide an observability framework for cloud-native software goes much further than that. Since OpenTelemetry combines concepts of both OpenTracing and OpenCensus, let's first look at each of these projects individually. Please refer to the following Twitter link, which announced OpenTelemetry by combining both concepts:
https://twitter.com/opencensusio/status/1111388599994318848.
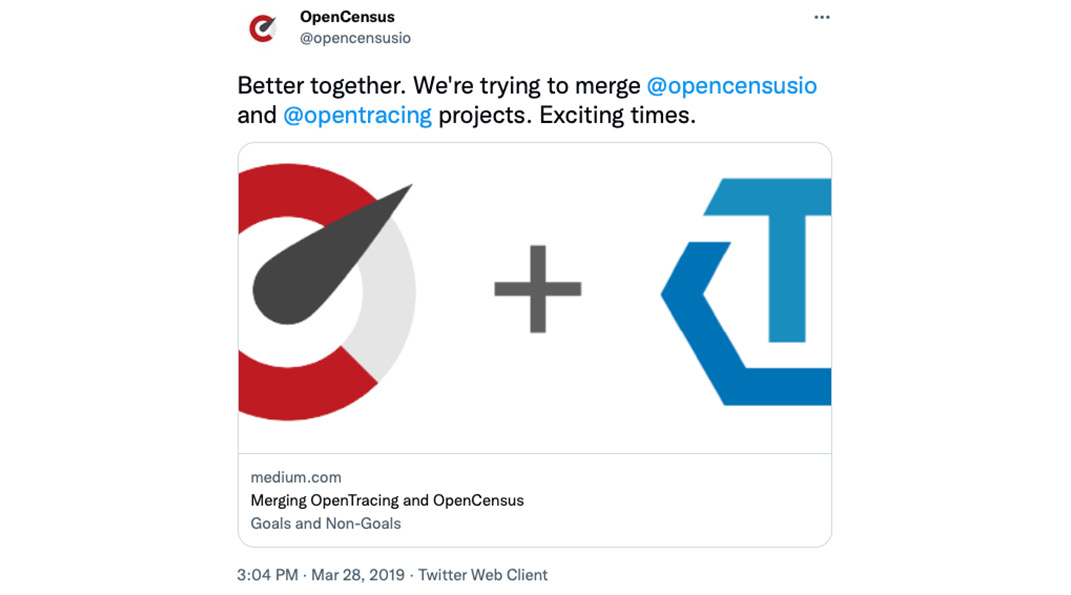
Figure 1.2 - Screenshot of the aforementioned tweet
OpenTracing
The OpenTracing (https://opentracing.io) project, started in 2016, was focused on solving the problem of increasing the adoption of distributed tracing as a means for users to better understand their systems. One of the challenges identified by the project was that adoption was difficult because of cost instrumentation and the lack of consistent quality instrumentation in third-party libraries. OpenTracing provided a specification for Application Programming Interface (APIs) to address this problem. This API could be leveraged independently of the implementation that generated distributed traces, therefore allowing application developers and library authors to embed calls to this API in their code. By default, the API would act as a no-op operation, meaning those calls wouldn't do anything unless an implementation was configured.
Let's see what this looks like in code. The call to an API to trace a specific piece of code resembles the following example. You'll notice the code is accessing a global variable to obtain a Tracer via the global_tracer method. A Tracer in OpenTracing, and in OpenTelemetry (as we'll discuss later in Chapter 2, OpenTelemetry Signals – Tracing, Metrics, and Logging, and Chapter 4, Distributed Tracing – Tracing Code Execution), is a mechanism used to generate trace data. Using a globally configured tracer means that there's no configuration required in this instrumentation code – it can be done completely separately. The next line starts aprimary building block, span. We'll discuss this further in Chapter 2, OpenTelemetry Signals – Tracing, Metrics, and Logging, but it is shown here to give you an idea of how a Tracer is used in practice:
import opentracing
tracer = opentracing.global_tracer()
with tracer.start_active_span('doWork'):
  # do work
The default no-op implementation meant that code could be instrumented without the authors having to make decisions about how the data would be generated or collected at instrumentation time. It also meant that users of instrumented libraries, who didn't want to use distributed tracing in their applications, could still use the library without incurring a performance penalty by not configuring it. On the other hand, users who wanted to configure distributed tracing could choose how this information would be generated. The users of these libraries and applications would choose a Tracer implementation and configure it. To comply with the specification, a Tracer implementation only needed to adhere to the API defined (https://github.com/opentracing/opentracing-python/blob/master/opentracing/tracer.py) , which includes the following methods:
- Start a new span.
- Inject an existing span's context into a carrier.
- Extract an existing span from a carrier.
Along with the specification for this API, OpenTracing also provides semantic conventions. These conventions describe guidelines to improve the quality of the telemetry emitted by instrumenting. We'll discuss semantic conventions further when exploring the concepts of OpenTelemetry.
OpenCensus
OpenCensus (https://opencensus.io) started as an internal project at Google, called Census, but was open sourced and gained popularity with a wider community in 2017. The project provided libraries to make the generation and collection of both traces and metrics simpler for application developers. It also provided the OpenCensus Collector, an agent run independently that acted as a destination for telemetry from applications and could be configured to process the data before sending it along to backends for storage and analysis. Telemetry being sent to the collector was transmitted using a wire format specified by OpenCensus. The collector was an especially powerful component of OpenCensus. As shown in Figure 1.3, many applications could be configured to send data to a single destination. That destination could then control the flow of the data without having to modify the application code any further:

Figure 1.3 – OpenCensus Collector data flow
The concepts of the API to support distributed tracing in OpenCensus were like those of OpenTracing's API. In contrast to OpenTracing, however, the project provided a tightly coupled API and Software Development Kit (SDK), meaning users could use OpenCensus without having to install and configure a separate implementation. Although this simplified the user experience for application developers, it also meant that in certain languages, the authors of third-party libraries wanting to instrument their code would depend on the SDK and all its dependencies. As mentioned before, OpenCensus also provided an API to generate application metrics. It introduced several concepts that would become influential in OpenTelemetry:
- Measurement: This is the recorded output of a measure, or a generated metric point.
- Measure: This is a defined metric to be recoded.
- Aggregation: This describes how the measurements are aggregated.
- Views: These combine measures and aggregations to determine how the data should be exported.
To collect metrics from their applications, developers defined a measure instrument to record measurements, and then configured a view with an aggregation to emit the data to a backend. The supported aggregations were count, distribution, sum, and last value.
As the two projects gained popularity, the pain for users only grew. The existence of both projects meant that it was unclear for users what project they should rely on. Using both together was not easy. One of the core components of distributed tracing is the ability to propagate context between the different applications in a distributed system, and this didn't work out of the box between the two projects. If a user wanted to collect traces and metrics, they would have to use OpenCensus, but if they wanted to use libraries that only supported OpenTracing, then they would have to use both – OpenTracing for distributed traces, and OpenCensus for metrics. It was a mess, and when there are too many standards, the way to solve all the problems is to invent a new standard!
It was a mess, and when there are too many standards, the way to solve all the problems is to invent a new standard! The following XKCD comic captures the sentiment very aptly:

Figure 1.4 – How standards proliferate comic (credit: XKCD, https://xkcd.com/927/)
Sometimes a new standard is a correct solution, especially when that solution:
- Is built using the lessons learned from its predecessors
- Brings together the communities behind other standards
- Supersedes two existing competing standards
The OpenCensus and OpenTracing organizers worked together to ensure the new standard would support a migration path for existing users of both communities, allowing the projects to eventually become deprecated. This would also make the lives of users easier by offering a single standard to use when instrumenting applications. There was no longer any need to guess what project to use!
Observability for cloud-native software
OpenTelemetry aims to standardize how applications are instrumented and how telemetry data is generated, collected, and transmitted. It also aims to give users the tools necessary to correlate that telemetry across systems, languages, and applications, to allow them to better understand their software. One of the initial goals of the project involved ensuring all the functionality that was key to both OpenCensus and OpenTracing users would become part of the new project. The focus on pre-existing users also leads to the project organizers establishing a migration path to ease the transition from OpenTracing and OpenCensus to OpenTelemetry. To accomplish its lofty goals, OpenTelemetry provides the following:
- An open specification
- Language-specific APIs and SDKs
- Instrumentation libraries
- Semantic conventions
- An agent to collect telemetry
- A protocol to organize, transmit, and receive the data
The project kicked off with the initial commit on May 1, 2019, and brought together the leaders from OpenCensus and OpenTracing. The project is governed by a governance committee that holds elections annually, with elected representatives serving on the committee for two-year terms. The project also has a technical committee that oversees the specification, drives project-wide discussion, and reviews language-specific implementations. In addition, there are various special interest groups (SIGs) in the project, focused on features or technologies supported by the project. Each language implementation has its own SIG with independent maintainers and approvers managing separate repositories with tools and processes tailored to the language. The initial work for the project was heavily focused on the open specification. This provides guidance for the language-specific implementations. Since its first commit, the project has received contributions from over 200 organizations, including observability leaders and cloud providers, as well as end users of OpenTelemetry. At the time of writing, OpenTelemetry has implementations in 11 languages and 18 special interest or working groups.
Since the initial merger of OpenCensus and OpenTracing, communities from additional open source projects have participated in OpenTelemetry efforts, including members of the Prometheus and OpenMetrics projects. Now that we have a better understanding of how OpenTelemetry was brought to life, let's take a deeper look at the concepts of the project.