

Recognizing who benefits from using packet analysis
Nearly everyone can benefit from using packet analysis, including developers, network administrators, students, and security analysts. Let's look at each group and explore the benefits that can be reaped through packet analysis. We'll start with developers, as they can see how their program responds to requests on the network in real time.
Assisting developers
Application performance issues can affect the bottom line, especially in a mission-critical situation. Developers diligently strive to produce elegant and efficient software. Prior to releasing an application, developers run functional and regression tests, along with stressing the server to ensure an optimized application.
Typically, developers test applications in a perfect environment, with high bandwidth and low latency. However, once the application moves from the local (or test) environment to the production network, clients may complain about the slow response times. The programmers will carefully check the application; however, on many occasions, they are unable to find anything unusual.
The developer must determine the reasons for the slow response times. Once further testing determines that it is not the application that is causing the issue, a packet analysis tool such as Wireshark can assist the developer.
By using packet analysis, the developer can uncover common problems in transmissions and help determine the root cause of the delayed response times. Problems such as delayed round-trip time and signs of congestion within an organization can occur in a network and impact response time.
Simply optimizing an application is not enough. All development life cycles should include checking what is happening on the network, as issues can affect overall performance.
In addition to developers, network administrators commonly use Wireshark to troubleshoot the network, as we will see next.
Helping network administrators monitor the network
Network administrators use packet analysis to gain information about current network conditions. Wireshark can help identify errors and/or problems on the network that might require device tuning and/or replacement to improve overall performance.
A powerful feature in Wireshark is the ability to quickly detect issues in the capture. The network administrator can use both the expert system and the intelligent scroll bar, which color codes potential problems and helps with analysis, as we'll see in the next section.
Expert system and intelligent scroll bar
Wireshark allows us to visualize issues while performing an analysis. The expert system categorizes various traffic conditions. It has a color code for each level that allows for easy identification of the general workflow and possible critical events:
- Chat color (blue): It provides information about typical workflows, such as a TCP window update or connection finish.
- Note color (cyan): It indicates items of interest, such as duplicate acknowledgments and TCP keepalive segments.
- Warn color (yellow): It indicates a warning, such as a TCP zero window or connection reset.
- Error color (red): It is the highest level as there might be a serious problem, such as a retransmission or a malformed packet.
The visual for the expert system is in the lower-left corner, as shown in the following screenshot:
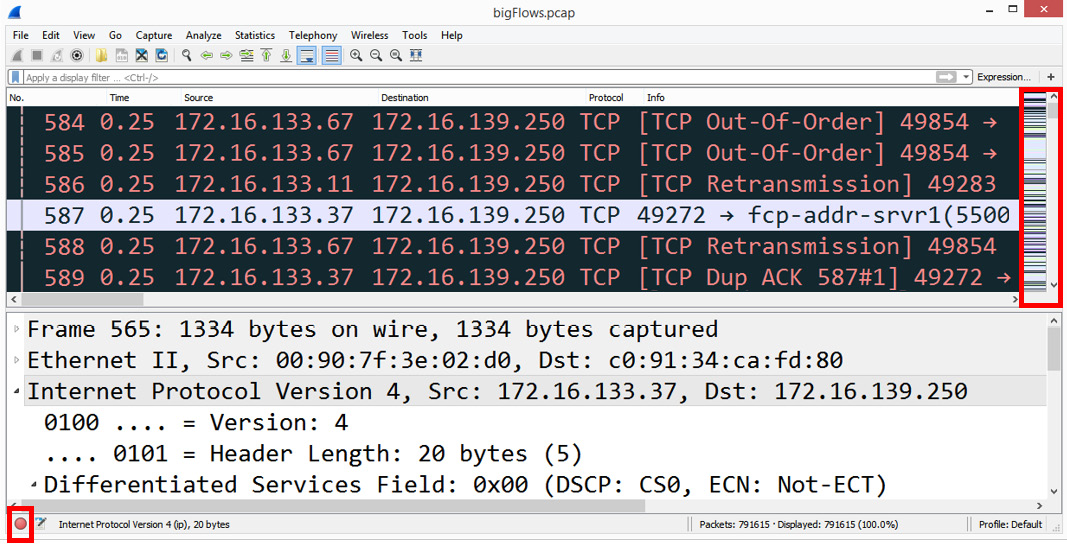
Figure 1.2 – Expert system and intelligent scroll bar
Wireshark also has an intelligent scroll bar, which provides a visual to detect issues. In the preceding screenshot, we can see a distinct coloring pattern on the right-hand side based on the coloring rules set in the application.
With the intelligent scroll bar, the administrator can easily click on a color band to zero in on a possible problem. Bear in mind that the intelligent scroll bar is only visible if the coloring rules are active; however, coloring rules are on by default.
Once any problems have been identified, you can subset traffic, add comments, save, and export the packet captures.
Subsetting traffic, commenting, saving, and exporting
There are times when the network administrator might only want to share a small subset of traffic with other members of the team. Wireshark can subset large captures so that you can focus on the problem areas.
For example, in addition to data, a large packet capture will most likely have several different types of traffic, such as management and 802.11 control frames. You can easily apply a filter using the ...and not selected option to exclude packets that are not relevant to the analysis.
Once you have created a smaller file, you can export the specified packets and save them in a wide variety of formats. Formats include the default PCAPNG, along with PCAP, Sun Snoop, DMP, and more.
Within the newly created subset, you can include comments. You can find comments in a couple of different ways:
- Select the comments icon that looks like a pad and pencil in the lower-left corner to add a comment for a single packet.
- Navigate to the Edit | Packet comment menu choice to add a comment for a single packet.
- Navigate to the Statistics | Capture file properties menu choice and include comments for an entire packet capture in the comment area at the bottom of the window.
Note
If you do add comments, then you must save the file in PCAPNG format, as not all file formats support the use of comments.
In addition to network administrators, students will gain valuable insight into what is actually happening on the network by using Wireshark to examine the headers and field values of the protocols.
Educating students on protocols
Students can use packet analysis as a learning tool to better understand protocols. For example, when reviewing the Dynamic Host Configuration Protocol (DHCP), a textbook will display the four stages of the process: Discover, Offer, Request, and Acknowledge (DORA). Take a look at the following diagram:
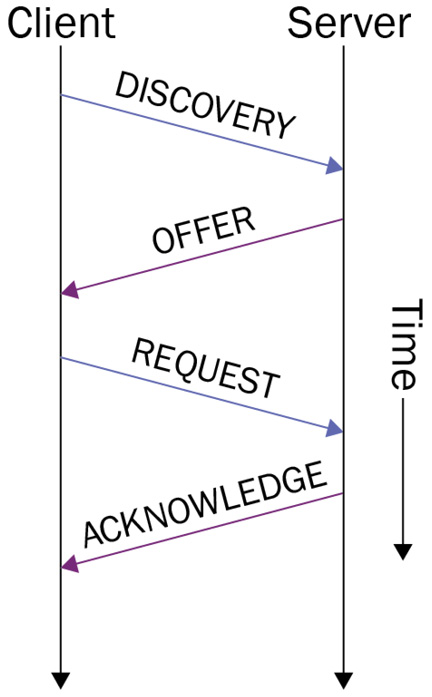
Figure 1.3 – The DORA process
While the preceding diagram displays each of the four-part transactions, it does not show the details of each part of the four-packet exchange.
In the following screenshot, we can see an actual DHCP transaction in Wireshark. In addition to this, the student can see the specifics of each exchange, including the transport protocol, the IP, the Media Access Control (MAC) addresses, and the DHCP header flags:
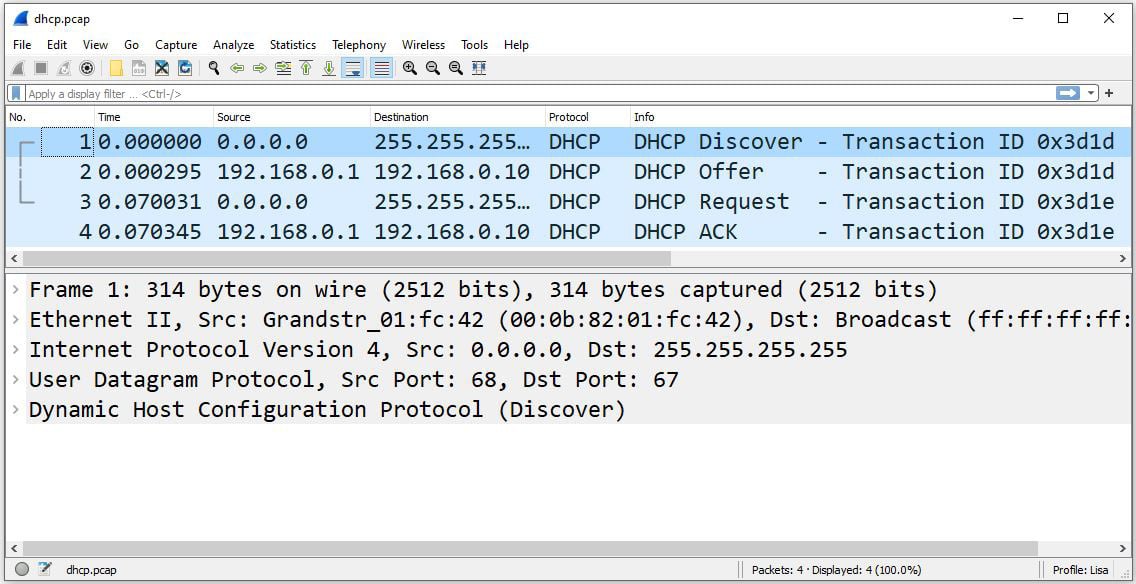
Figure 1.4 – The DORA process in Wireshark
By learning the normal behavior and purposes of common protocols, students will be able to troubleshoot any problems that might occur in the future.
As you can see, packet analysis has many benefits for many people. Because of the ability to really examine what is happening on the network, another key group that uses packet analysis is security analysts.
Alerting security analysts to threats
To effectively discover potential problems, a security analyst must be an expert at packet analysis, as they use packet analysis in various ways:
- Determine whether there is anything unusual or suspicious about the traffic.
- Discover what transpired on the network when completing a forensic investigation.
Wireshark can help the security analyst better understand specific types of attacks so that they can craft firewall rules. To hone security analysis skills, the analyst can discover and download many PCAPs on various repositories. The Honeynet project, which is located at https://www.honeynet.org, is a great place to start. Navigate to the section on CHALLENGES, which offers many examples of forensic exercises to review and learn about many common threats found on today's networks.
Once you are on the CHALLENGES page, search for Challenge 12 - Hiding in Plain Sight, and read the details regarding the challenge. Then, to strengthen your analysis skills, download the files found at the bottom of the page and work through the questions. The answers can also be found at the bottom of the page, along with other files of interest.
Security analysts feel that Wireshark is a valuable tool as it provides insight into what is happening on the network. Because of its ability to have so much insight into what is happening on the network, Wireshark is also used by hackers for reconnaissance in order to gather and analyze traffic. This could be many times prior to an attack or during an active attack, which we will discuss next.
Arming hackers with information
Malicious actors use packet analysis to sniff network traffic, with the goal of obtaining sensitive information. In addition, they can use the information gathered to launch an active attack.
When used as a precursor to an attack, hackers gather information during reconnaissance, which is also called footprinting. Let's take a look at a couple of ways in which hackers use Wireshark as part of a passive attack.
Outlining passive attacks
Using Wireshark (or a similar tool), a malicious actor will try to obtain confidential information traveling through the network to achieve the following goals:
- Footprinting and reconnaissance: As a precursor to an active attack, malicious actors capture traffic to gather as much information about the target as possible. In addition to this, Wireshark can be used to gather additional information such as IP and MAC addresses, open ports and services, and possible defense methods that are in place.
- Sniffing plain text: Another use of packet sniffing is looking for passwords that are sent in plain text. In addition, protocols such as SNMP, HTTP, FTP, Telnet, and VoIP that are sent in plain text are susceptible to packet sniffers. Once captured, the protocol can expose information about the network and/or system(s).
An organization can defend against unauthorized packet sniffing in a couple of ways. There is anti-sniffer software that can detect sniffers on the network. However, one of the best ways to prevent data exposure is to use encryption. If someone captures the traffic, then the encrypted data will appear meaningless.
Next, we'll take a look at how hackers can also use Wireshark by actively sniffing and monitoring traffic as part of an Address Resolution Protocol (ARP) spoofing attack.
Understanding active attacks
Malicious actors launch many different types of attacks on the network, such as Denial of Service (DoS), phishing, or Structured Query Language (SQL) injection attacks. Next, let's take a look at another type of attack: an ARP cache poison attack.
Poisoning the cache
ARP cache poisoning, also known as ARP spoofing, is used in a Man-in-the-Middle (MitM) attack. In order to understand why this is an effective attack, let's walk through the normal use of ARP on a LAN.
On a LAN, hosts are identified by their MAC (or physical) addresses. In order to communicate with the correct host, each device keeps track of all LAN hosts' MAC addresses in an ARP or MAC address table, also known as an ARP cache table.
Entries in the ARP or MAC address table will time out after a while. Under normal circumstances, when the device needs to communicate with another device on the network, it needs its own MAC address. First, the device will check the ARP cache and, if there is no entry in the table, the device will send an ARP request broadcast out to all hosts on the network.
The ARP request asks the following question: who has (the requested) IP address? Tell me (the requesting) IP address. The device will then wait for an ARP reply, as shown in the following screenshot:
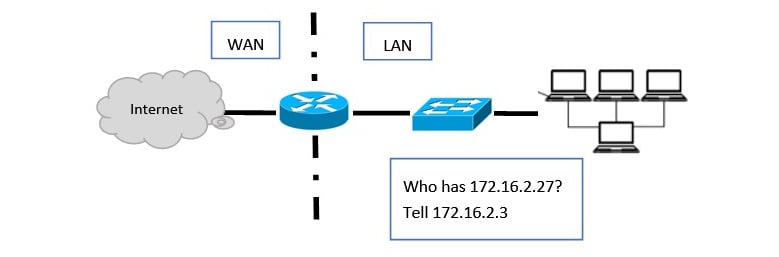
Figure 1.5 – ARP broadcast on a network
The ARP reply is a response that holds information on the host's IP address and the requested MAC address. Once received, the ARP cache is updated to reflect the MAC address.
In an ARP spoofing attack, a malicious actor will do the following:
- Send an unsolicited ARP reply message that contains a spoofed MAC address for the attacker's machine to all hosts on the LAN.
- After the ARP reply is received, all devices on the LAN will update their ARP (or MAC address) tables with the incorrect MAC address. This effectively poisons the cache on the end devices.
- Once the ARP tables are poisoned, this will allow an intruder to impersonate another host to gain access to sensitive information.
ARP spoofing is done during a MitM attack, which allows a malicious actor to obtain traffic that is normally destined to go to another host.
In the following diagram, a bogus ARP reply was sent by the malicious actor, which then poisoned the cache in all of the network devices. All hosts on the network now think that 10.40.10.103 is at 46:89:FF:4C:57:BB, instead of 00:80:68:B4:87:EF, and will go to the attacker with the spoofed MAC address:
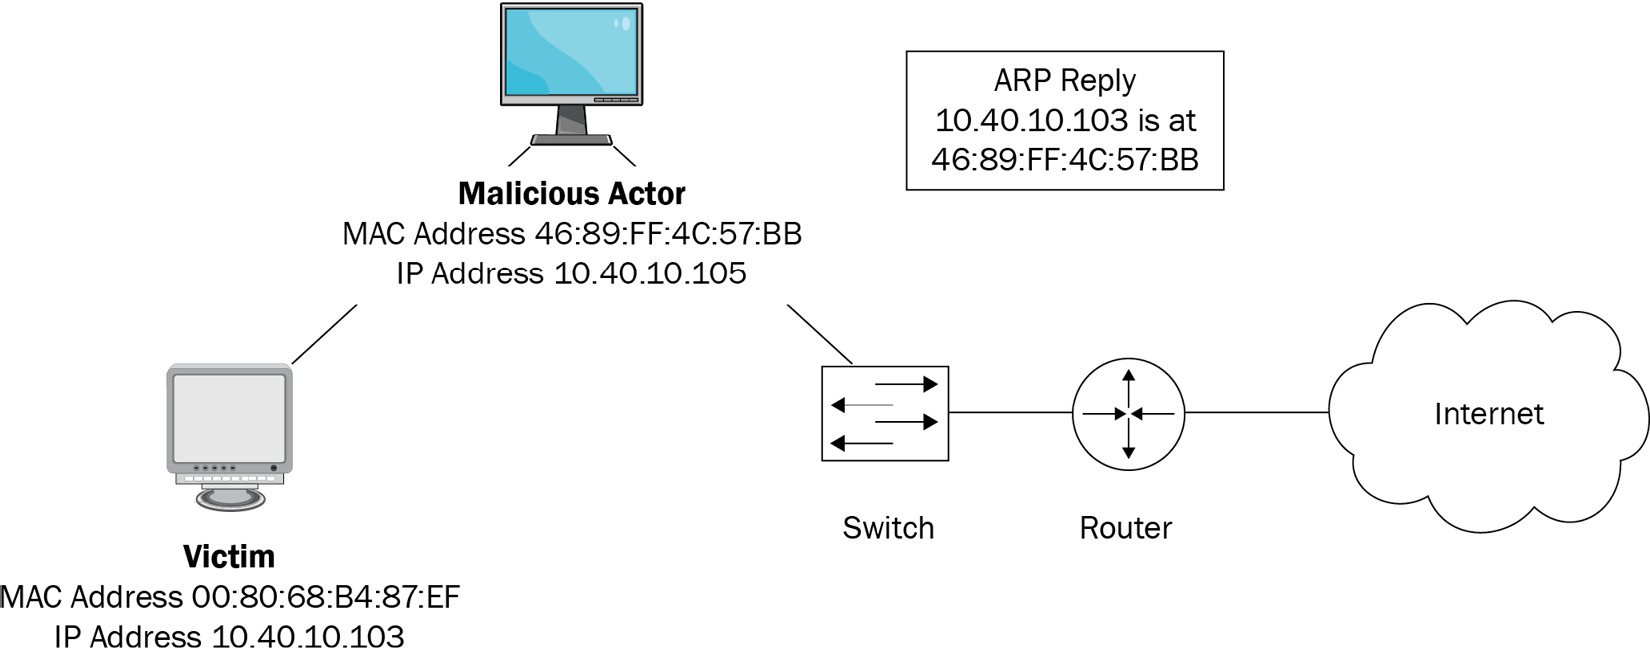
Figure 1.6 – An ARP spoof attack
The malicious actor will then use active sniffing to gather the misdirected traffic in an attempt to obtain sensitive information. In most cases, the traffic sent to the malicious actor is forwarded to the victim, who has no idea that anything is amiss.
Now we have seen the many individuals who can benefit from using packet analysis. In the next section, we will examine where packet analysis is most effective.