Book Image

Mastering Python Networking - Third Edition

By : Eric Chou
Book Image

Mastering Python Networking - Third Edition

By: Eric Chou

Overview of this book

Networks in your infrastructure set the foundation for how your application can be deployed, maintained, and serviced. Python is the ideal language for network engineers to explore tools that were previously available to systems engineers and application developers. In Mastering Python Networking, Third edition, you’ll embark on a Python-based journey to transition from traditional network engineers to network developers ready for the next-generation of networks. This new edition is completely revised and updated to work with Python 3. In addition to new chapters on network data analysis with ELK stack (Elasticsearch, Logstash, Kibana, and Beats) and Azure Cloud Networking, it includes updates on using newer libraries such as pyATS and Nornir, as well as Ansible 2.8. Each chapter is updated with the latest libraries with working examples to ensure compatibility and understanding of the concepts. Starting with a basic overview of Python, the book teaches you how it can interact with both legacy and API-enabled network devices. You will learn to leverage high-level Python packages and frameworks to perform network automation tasks, monitoring, management, and enhanced network security followed by Azure and AWS Cloud networking. Finally, you will use Jenkins for continuous integration as well as testing tools to verify your network.
Table of Contents (18 chapters)
16
Other Books You May Enjoy
17
Index

Data visualization with Kibana

So far, we have used Kibana to discover data, manage indices in Elasticsearch, use developer tools to develop queries, and use a few other features. We also saw the pre-populated visualization charts from NetFlow, which gave us the top talker pair from our data. In this section, we will walk through the steps of creating our own graphs. We will start by creating a pie chart.

A pie chart is great at visualizing a portion of the component in relation to the whole. Let's create a pie chart based on the Filebeat index that graphs the top 10 source IP addresses based on the number of record counts. We will select Visualization -> New Visualization -> Pie:

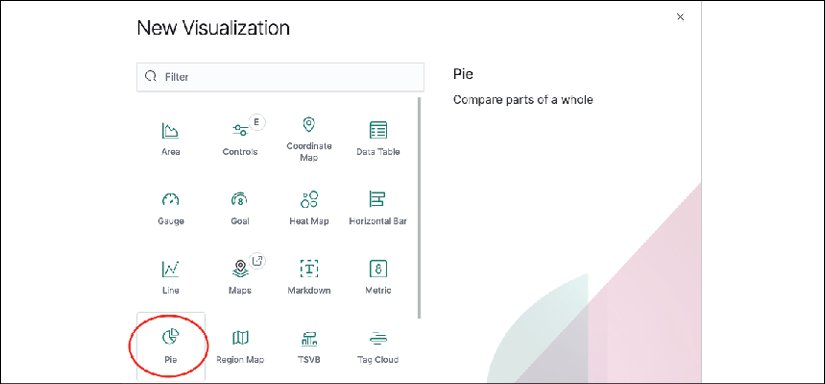
Figure 21: Kibana pie chart

Then we will type netflow in the search bar to pick our [Filebeat NetFlow] indices:

Figure 22: Kibana pie chart source

By default, we are given the total count of all the records in the default time range. The time range can be dynamically changed...