Book Image

Microsoft Tabular Modeling Cookbook

By : Paul te Braak
Book Image

Microsoft Tabular Modeling Cookbook

By: Paul te Braak

Overview of this book

Business Intelligence Semantic Models (BISM) is a technology that is designed to deliver analytical information to users through a variety of mechanisms that include model structure, definition, and design. This book demonstrates how to create BISM models so that information can be presented to users in an intuitive and easy-to-use format. Once the model is defined, we also show you how it can be managed and maintained so that the data in it remains current and secure. Microsoft Tabular Modeling Cookbook is an all-encompassing guide to developing, managing, creating, and using analytical models using the Business Intelligence Semantic Model (BISM). This title covers a range of modeling situations and common data analysis related problems to show you the techniques required to turn data into information using tabular modeling. Microsoft Tabular Modeling Cookbook examines three areas of tabular modeling: model development, model management and maintenance, and reporting. This book is a practical guide on how to develop semantic models and turn business data into information. It covers all phases of the model lifecycle from creation to administration and finally reporting. It also shows you how to create models which are designed to analyze data. All sections of BISM modeling from development to management and finally reporting are covered. The sections on development examine a wide range of techniques and tricks required to build models, including moving data into the model, structuring the model to manipulate the data, and finally the formulas required to answer common business questions; all of these are discussed in this book in detail. Finally, the book examines methods of reporting on the data within the model, including the creation of data-driven workbooks and reports for a powerful end user experience.
Table of Contents (18 chapters)
Microsoft Tabular Modeling Cookbook
Credits
About the Author
About the Reviewers
www.PacktPub.com
Preface
Index

Allocating data at different levels


Often, we have to present two data sources and compare them as if they were one. A typical example of this type of situation is the comparison of budget data to actuals. More often than not, the budgets are prepared at a much higher-level of grain than of actual data.

Consider the sales data that has been used in this chapter. We may define the grain of this as Reseller, Date, and Product. The actual grain of the table is, of course, a lower-level since it includes additional fields such as Sales Order and Geography, but for our purposes, this is the grain that we have chosen to present to the model user. Now, consider some high-level budget data that simply shows the budgeted sales (USD Gross Sales) by Quarter and Year. Our goal is to incorporate this into the model. Have a look at the following screenshot:

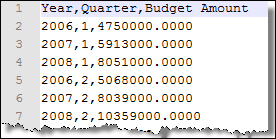
There are two common approaches that are commonly used to solve this problem. Firstly, the original data is arbitrarily assigned to a member within...