

Sections and breaks are two similar ways to group the data according to a specific dimension or an attribute object value.
Sections and breaks help us to create a better view of the data as well as apply logical grouping to it, for example, we can group the data in the report by the product type or the sales year. Last but not least, sections and breaks enable us to perform subtotals, which are a key calculation embedded in reporting and analysis.
We already have a table displaying the Year, Quarter, and Sales revenue data, and we want to apply a break on the Year dimension column in order to display the subtotals of each year.
In order to create a break, we can either use the Analysis toolbar and under it navigate to the Display tab, or simply right-click on the Year column in the table and use the Break option located in the speed menu, as shown in the following screenshot:
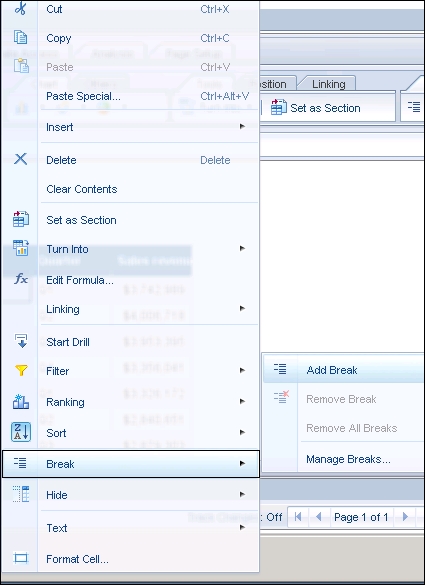
After we choose this option, the table will be separated according...