

The exact composition of the teams whose principal job is to enable their coworkers to make data-driven decisions will vary as a business's entire data strategy matures. However, many misinterpret what it means to run a mature data-driven business. They believe that at some point all data will and should be governed, and that the team that develops the first QlikView data exploration and discovery projects with will be that governing body.
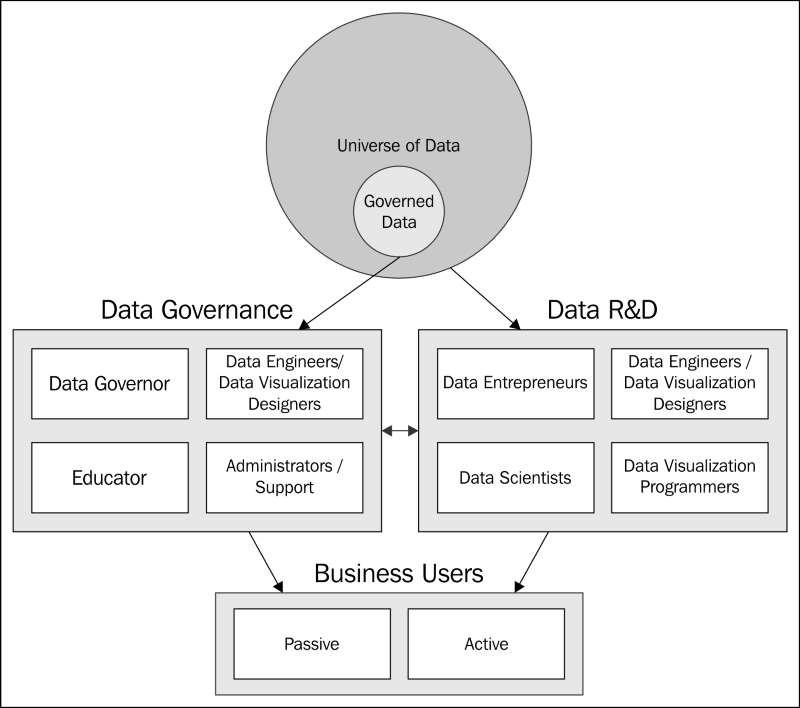
While a mature data-driven business does count with a large set of governed data and a talented data governance team, it should never be without new, unknown datasets, or without ideas about how to exploit existing datasets in new ways. It is also unrealistic that the same team enforce conformity at the same time that they must strive to innovate. It is for that reason that every mature data-driven business should have both a data research and development (R&D) team, and a data governance team. Each team will have a different data visualization strategy.
The data R&D team is constantly investigating and creating new solutions to our business problems. When we implement our first data exploration and discovery projects using QlikView, it is common to find out that we are part of a cross-functional, investigative, and proactive team. This team can be the keystone of a more formal data R&D team.
At a minimum, the team should consist of data engineers, data visualization designers, and data entrepreneurs. Data scientists and data visualization programmers may be optional in the beginning, but they become important elements to add as we continue to revolutionize how our business uses data.
It is worth repeating that even though this team will start the data exploration and discovery process, it will not evolve into the data governance team. Instead, this team will continue to look for ever more innovative ways to create business value from data. Once the team develops a stable solution with a long life expectancy, they will migrate that solution and transfer their knowledge to the data governance team.
Our data R&D teams will range in size and capacity, but in general, we aim to cover the following roles within a team that uses QlikView as its primary data exploration tool.
Note
The list of roles is not all-inclusive, and our business may have particular necessities or other tools for which we need to add other roles.
Data entrepreneurs: We look to fill this role with a business analyst who has knowledge of the company, the available datasets, and the business user requirements. We also look for our data entrepreneur to be an early adopter and a cornucopia of ideas to solve the most important problems. They work with all the other team members to develop solutions as the product owner.
Data engineers/data visualization designers: Although this role can be split between two people, QlikView has revolutionized this role. We can now realistically expect that the same person who extracts, transforms, and models data, can also formulate metrics and design insightful data visualization with the data entrepreneur's guidance.
Data visualization programmers: Although this profile is likely not necessary in the beginning, we will eventually need somebody proficient in web development technologies who can create custom data visualizations. For example, we would need this role to create charts that are not native to QlikView like the following cycle plot chart we use for our sales perspective in Chapter 2, Sales Perspective. This role can also be outsourced depending on its importance.

Data scientists: Data science is an ambiguous term. Like many of us who work with data, data scientists are ultimately concerned with extracting knowledge from data. However, they are more focused on using statistics, data mining, and predictive analysis to do so. If they aren't part of the team from the beginning, we should add them later to ensure that the data R&D team continues to innovate.
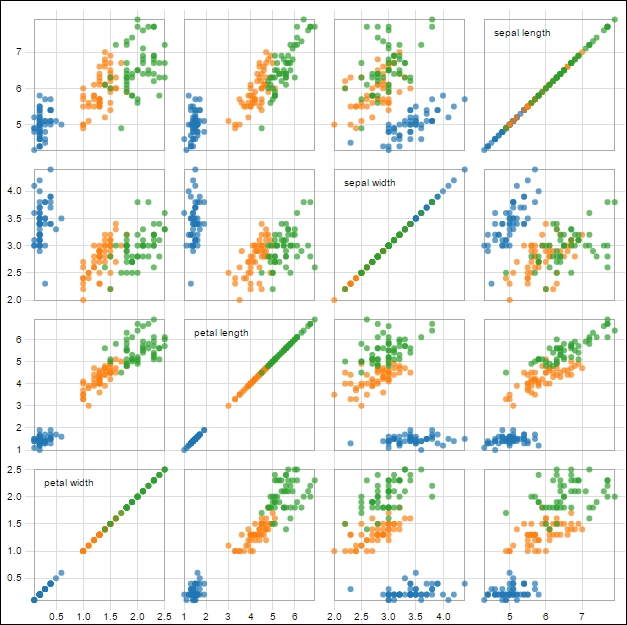
As far as data visualization is concerned, every member of the data R&D team uses it to make sense of the data and communicate their discoveries with their peers. As such, they should be given space to experiment with advanced data visualization techniques, even when those techniques may appear obscure, or even esoteric. For example, the following scatterplot matrix may not be suitable for most business users, but may help a data scientist create a predictive model:
Note
Data Visualization Strategy 2: Encourage the data R&D team to experiment with new data visualization techniques.
When the data R&D team creates a stable, long-term analytical solution that is going to be used by business users to make their own discoveries, then they should migrate that solution to the data governance team. At this point, both teams should work together to make the data visualization as clear and simple as possible for the business user. While we may be able to train them to use some new data visualization techniques, we will also have to translate other advanced data visualizations into the more commonly used sort.
Data governance is a fundamental part of enabling our entire business to be data driven. The data that is used across the whole company to support common business activities, such as employee performance reviews, financial investments, and new product launches, should be held to a set of standards that ensures its trustworthiness. Among the standards that the data governance team defines and enforces are business rules, data accuracy, data security, and data definitions. The data governance team's job is no less challenging than that of the data R&D team, not the least being because they are the face of the data for most of the business users.
Data governance has a responsibility to make sure data is visualized in a way that is accessible to all business users. Data visualizations should use proper colors, adequate labeling, and approved metrics. The data governance team is also responsible for helping the business users understand data visualization standards, and support those who are going to actively use data to create their own analyses.
Just like our data R&D team, the exact size and makeup of the data governance team will vary. The following list contains the roles that we wish to fill in a team that uses QlikView as its primary data exploration tool:
Data governor: We look for somebody with a similar background as the data entrepreneur in the data R&D team to fill this role. However, the data governor's responsibility is to ensure data quality, uniform business rules, security, and accessible data visualization. They can also be referred to as data stewards. Similar to data entrepreneurs, they help the other team members prioritize pending tasks.
Data engineer/data visualization designer: We create this role to receive solutions from the R&D team and bring them up to the data governance's standards. In addition, they develop QlikView applications for internal control. Even though they don't belong to the R&D team, we expect them to develop innovative ways to visualize the data so that they can enforce the company's data standards more effectively. For example, the following process control chart is an example of the visual analysis that would help them detect data anomalies:

Administrator/Support: This role helps us reduce the distractions our data engineers and data visualization designers face when dealing with daily administration and support issues. Since common QlikView support issues include users unable to access their applications and automatic reload failures, we can often assign the same person to both administrator and support.
Educator: This role performs the never-ending and pivotal job of making business users feel comfortable using the analytical solutions that we develop. Along with teaching business users to use QlikView, they also review the application's content. It is important to note that understanding data visualization is not innate. Therefore, our educators have the responsibility to teach business users how to interpret both simple and advanced data visualizations.
The data governance team may experiment with some data visualization techniques to best analyze , for example, data accuracy or QlikView Server log data. However, for the most part, the data governance team is responsible for establishing and enforcing data visualization standards that create trustworthiness, increase accessibility, facilitate maintenance, reduce training time, and promote clear enterprise communication.
Note
Data Visualization Strategy 3: Enable the data governance team to establish and enforce data visualization standards.
Each team has a separate set of tasks and priorities. However, all data teams should take advantage of agile project management. The data governance team should be especially careful not to confuse data governance with the creation of bureaucratic project management methods. Otherwise, any competitive advantage gained by using QlikView for fast, flexible data exploration and discovery will be wasted.