Book Image

Mastering QlikView Data Visualization

By : Karl Pover
Book Image

Mastering QlikView Data Visualization

By: Karl Pover

Overview of this book

Just because you know how to swing a hammer doesn't mean you know how to build a house. Now that you've learned how to use QlikView, it's time to learn how to develop meaningful QlikView applications that deliver what your business users need. You will explore the requirements and the data from several business departments in order to deliver the most amazing analysis and data visualizations. In doing so, you will practice using advanced QlikView functions, chart object property options, and extensions to solve real-world challenges.
Table of Contents (18 chapters)
Mastering QlikView Data Visualization
Credits
About the Author
About the Reviewers
www.PacktPub.com
Preface
Index

Working capital breakdown


We complement the previous section's working capital analysis with a closer look at the elements that make up each measure. In the case of DSI, we analyze Average Inventory Value and Annual Cost of Goods Sold (COGS). This auxiliary analysis helps us understand whether an increasing DSI is the result of rising inventory levels or decreasing sales. It also helps us detect which product is not rotating frequently enough.

Note

As a warehouse manager, I want to know which items spend the most time in the warehouse and whether this is because there is too much stock or too few sales. This information will help me reduce the amount of unnecessary stock and free up available cash.

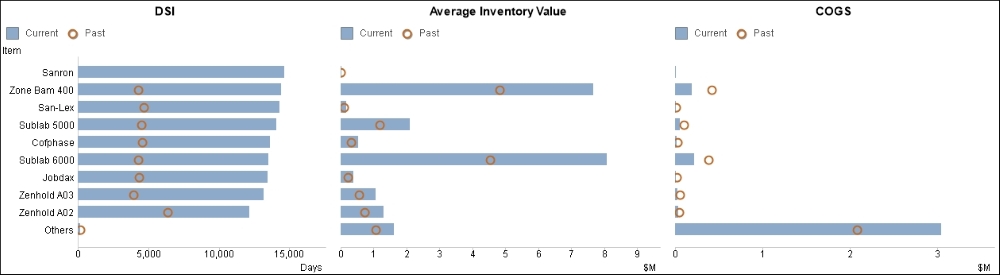
Let's combine the related metrics and have them share the same dimension axis, as in the following visualization:

Exercise 5.5

  1. Let's create three separate combo charts. We represent the current period with bars and the last period with circles. In each chart, we set the orientation to be horizontal...