

We have studied two-dimensional heat maps, but R also allows us to plot three-dimensional interactive heat maps using the NeatMap package. The NeatMap package manual states the limitation of using the heatmap() function as "The traditional clustered heatmap makes use of cluster analysis to re-order rows and columns such that similar elements are placed together. However, cluster analysis is a poor choice for ordering method since this does not provide a unique ordering".
In order to plot a three-dimensional heat map and a stereo map, we would need to install the NeatMap package available in R.
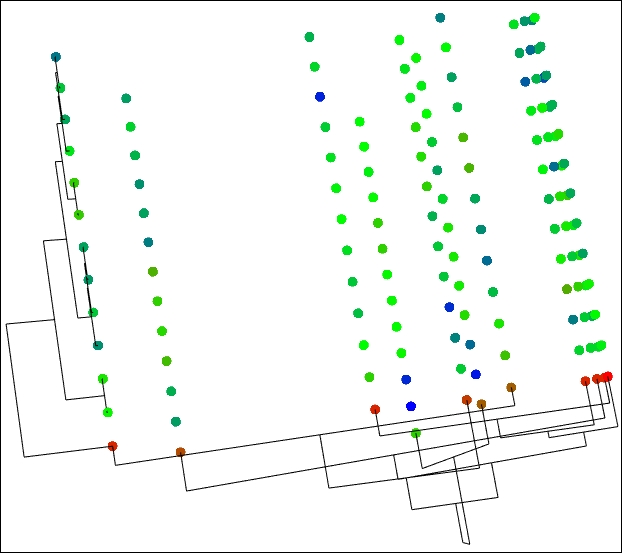
In order to plot a three-dimensional heat map and a stereo map, we would start by loading the NeatMap package and load the data. After loading and cleaning the data, we would use make.profileplot3D() and make.stere.profileplot3D to plot three-dimensional heat maps and stereo maps, respectively:
library(NeatMap)
irq = read...