
There's a story that, while almost certainly apocryphal, allows us to look in more detail at the way in which the central limit theorem allows us to reason about how distributions are formed. It concerns the celebrated nineteenth century French polymath Henri Poincaré who, so the story goes, weighed his bread every day for a year.
Baking was a regulated profession, and Poincaré discovered that, while the weights of the bread followed a normal distribution, the peak was at 950g rather than the advertised 1kg. He reported his baker to the authorities and so the baker was fined.
The next year, Poincaré continued to weigh his bread from the same baker. He found the mean value was now 1kg, but that the distribution was no longer symmetrical around the mean. The distribution was skewed to the right, consistent with the baker giving Poincaré only the heaviest of his loaves. Poincaré reported his baker to the authorities once more and his baker was fined a second time.
Whether the story is true or not needn't concern us here; it's provided simply to illustrate a key point—the distribution of a sequence of numbers can tell us something important about the process that generated it.
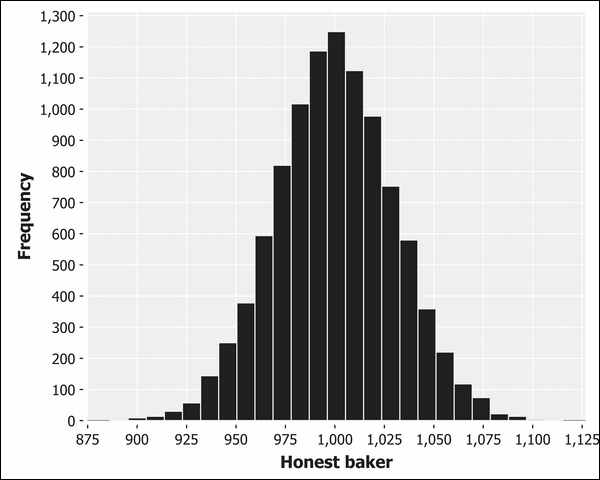
To develop our intuition about the normal distribution and variance, let's model an honest and dishonest baker using Incanter's distribution functions. We can model the honest baker as a normal distribution with a mean of 1,000, corresponding to a fair loaf of 1kg. We'll assume a variance in the baking process that results in a standard deviation of 30g.
(defn honest-baker [mean sd]
  (let [distribution (d/normal-distribution mean sd)]
    (repeatedly #(d/draw distribution))))

(defn ex-1-18 []
  (-> (take 10000 (honest-baker 1000 30))
      (c/histogram :x-label "Honest baker"
                   :nbins 25)
      (i/view)))
The preceding code will provide an output similar to the following histogram:
Now, let's model a baker who sells only the heaviest of his loaves. We partition the sequence into groups of thirteen (a "baker's dozen") and pick the maximum value:
(defn dishonest-baker [mean sd]
  (let [distribution (d/normal-distribution mean sd)]
    (->> (repeatedly #(d/draw distribution))
         (partition 13)
         (map (partial apply max)))))

(defn ex-1-19 []
  (-> (take 10000 (dishonest-baker 950 30))
      (c/histogram :x-label "Dishonest baker"
                   :nbins 25)
      (i/view)))
The preceding code will produce a histogram similar to the following:
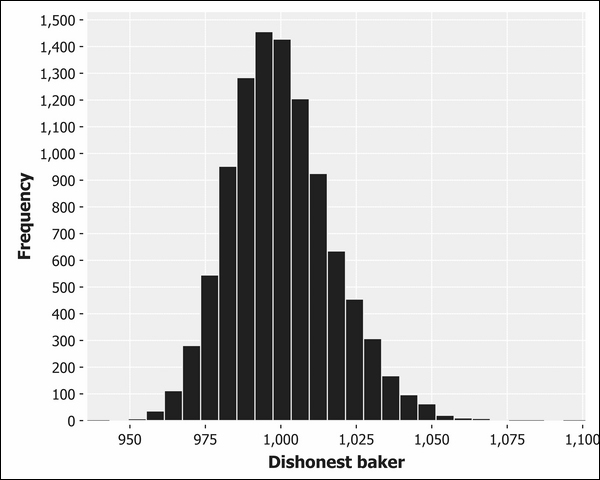
It should be apparent that this histogram does not look quite like the others we have seen. The mean value is still 1kg, but the spread of values around the mean is no longer symmetrical. We say that this histogram indicates a skewed normal distribution.