Book Image

Python Data Analysis Cookbook

By : Ivan Idris
Book Image

Python Data Analysis Cookbook

By: Ivan Idris

Overview of this book

Data analysis is a rapidly evolving field and Python is a multi-paradigm programming language suitable for object-oriented application development and functional design patterns. As Python offers a range of tools and libraries for all purposes, it has slowly evolved as the primary language for data science, including topics on: data analysis, visualization, and machine learning. Python Data Analysis Cookbook focuses on reproducibility and creating production-ready systems. You will start with recipes that set the foundation for data analysis with libraries such as matplotlib, NumPy, and pandas. You will learn to create visualizations by choosing color maps and palettes then dive into statistical data analysis using distribution algorithms and correlations. You’ll then help you find your way around different data and numerical problems, get to grips with Spark and HDFS, and then set up migration scripts for web mining. In this book, you will dive deeper into recipes on spectral analysis, smoothing, and bootstrapping methods. Moving on, you will learn to rank stocks and check market efficiency, then work with metrics and clusters. You will achieve parallelism to improve system performance by using multiple threads and speeding up your code. By the end of the book, you will be capable of handling various data analysis techniques in Python and devising solutions for problem scenarios.
Table of Contents (23 chapters)
Python Data Analysis Cookbook
Credits
About the Author
About the Reviewers
www.PacktPub.com
Preface
Glossary
Index

Measuring central tendency of noisy data


We can measure central tendency with the mean and median. These measures use all the data available. It is a generally accepted idea to get rid of outliers by discarding data on the higher and lower end of a data set. The truncated mean or trimmed mean, and derivatives of it such as the interquartile mean (IQM) and trimean, use this idea too. Take a look at the following equations:

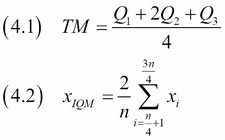
The truncated mean discards the data at given percentiles—for instance, from the lowest value to the 5th percentile and from the 95th percentile to the highest value. The trimean (4.1) is a weighted average of the median, first quartile, and third quartile. For the IQM (4.2), we discard the lowest and highest quartile of the data, so it is a special case of the truncated mean. We will calculate these measures with the SciPy tmean() and trima() functions.

How to do it...

We will take a look at the central tendency for varying levels of truncation with the following steps:

  1. The...