Book Image

Qlikview Unlocked

Book Image

Qlikview Unlocked

Overview of this book

QlikView Unlocked will provide you with new insights to get the very best from QlikView. This book will help you to develop skills to work with data efficiently. We will cover all the secrets of unleashing the full power of QlikView, which will enable you to make better use of the tool and create better results for future projects. In the course of this book, we will walk you through techniques and best practices that will enable you to be more productive. You will gain quick insights into the tool with the help of short steps called ”keys,” which will help you discover new features of QlikView. Moving on you will learn new techniques for data visualization, scripting, data modeling, and more. This book will then cover best practices to help you establish an efficient system with improved performance. We will also teach you some tricks that will help you speed up development processes, monitor data with dashboards, and so on. By the end of this book, you will have gained beneficial tips, tricks, and techniques to enhance the overall experience of working with QlikView.
Table of Contents (16 chapters)
QlikView Unlocked
Credits
About the Authors
About the Reviewers
www.PacktPub.com
Preface
Hidden Image List
Index

Making charts more readable


Occasionally, we have used Borchester Models' data to demonstrate certain ideas and features. Have a look at this script fragment:

Stock:
LOAD [Shop No], 
     [Product Code], 
     [On Hand]
FROM
[QlikView Unlocked Data.xlsx]
(ooxml, embedded labels, table is Stock);

What is required here is a chart showing stock levels by product across all shops. However, if we just let QlikView do the sorting, it will use Product Code, and we will see something similar to this:

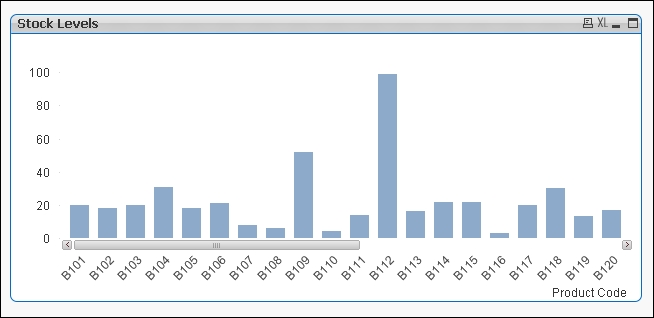
This is okay, but it's not really helpful. As there's a scroll bar, we can't see what we have the most stock of—it might be B112, but unless we scroll across, we won't know. Furthermore, it is hard to determine the relative differences between the stock levels of other products.

To make this much more readable, we just need to make a simple change in the properties of the chart object on the Sort tab, as follows:

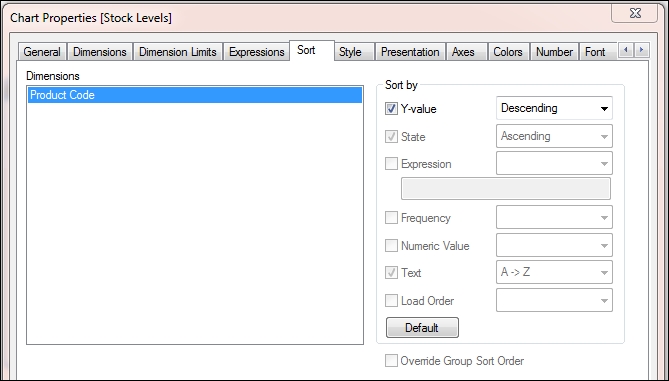
By simply changing the sort to Y-value (and in this case, using the default Descending option...