-
Book Overview & Buying
-
Table Of Contents

-
Feedback & Rating

Data Analysis and Business Modeling with Excel 2013
By :
Data Analysis and Business Modeling with Excel 2013
By:
Overview of this book
Excel 2013 is one of the easiest to use data analysis tools you will ever come across. Its simplicity and powerful features has made it the go to tool for all your data needs. Complex operations with Excel, such as creating charts and graphs, visualization, and analyzing data make it a great tool for managers, data scientists, financial data analysts, and those who work closely with data. Learning data analysis and will help you bring your data skills to the next level.
This book starts by walking you through creating your own data and bringing data into Excel from various sources. You’ll learn the basics of SQL syntax and how to connect it to a Microsoft SQL Server Database using Excel’s data connection tools. You will discover how to spot bad data and strategies to clean that data to make it useful to you. Next, you'll learn to create custom columns, identify key metrics, and make decisions based on business rules. You’ll create macros using VBA and use Excel 2013’s shiny new macros. Finally, at the end of the book, you'll be provided with useful shortcuts and tips, enabling you to do efficient data analysis and business modeling with Excel 2013.
Table of Contents (13 chapters)
Preface

 Free Chapter
1. Getting Data into Excel
2. Connecting to Databases
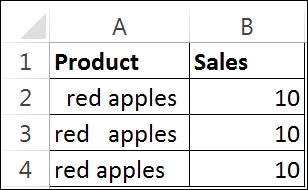
3. How to Clean Texts, Numbers, and Dates
4. Using Formulas to Prepare Your Data for Analysis
5. Analyzing Your Data Using Descriptive Statistics and Charts
6. Link Your Data Using Data Models
7. A Primer on Using the Excel Solver
8. Learning VBA – Excel's Scripting Language
9. How to Build and Style Your Charts
10. Creating Interactive Spreadsheets Using Tables and Slicers
A. Tips, Tricks, and Shortcuts
Index
Customer Reviews