
This part is going to be easy because the data has already been gathered and it is available in the Chapter 05 folder. It contains three CSV files and each file represents a specific table in the database.
Fire up Excel 2013 and create a new spreadsheet. Create two more tabs in addition to the Sheet1 tab that has already been created for you by default. Rename Sheet1, Sheet2, and Sheet3 as
pmthistory,rateplan, andusers, respectively, as shown in the following screenshot: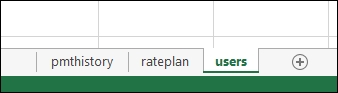
Copy the data from the three spreadsheets to their respective tabs:
Pmthistory.csvto the pmthistory tabRateplan.csvto the rateplan tabUsers.csvto the users tab
You will now have 138 rows in the pmthistory tab, two rows in the rateplan tab, and five rows in the users tab.
Tip
As an alternative, you can also use the Move or Copy sheet option that we learned in Chapter 1, Getting Data into Excel, to copy the data into a new workbook.
Create a new tab and call it
report. Note that you can click and drag the tabs...